Workshop/Consultancy

UN ozone celebrations

CLIENT

United Nations Environment Programme

PURPOSE

To communicate and celebrate 30 years of international effort in protecting the ozone layer.

DESCRIPTION

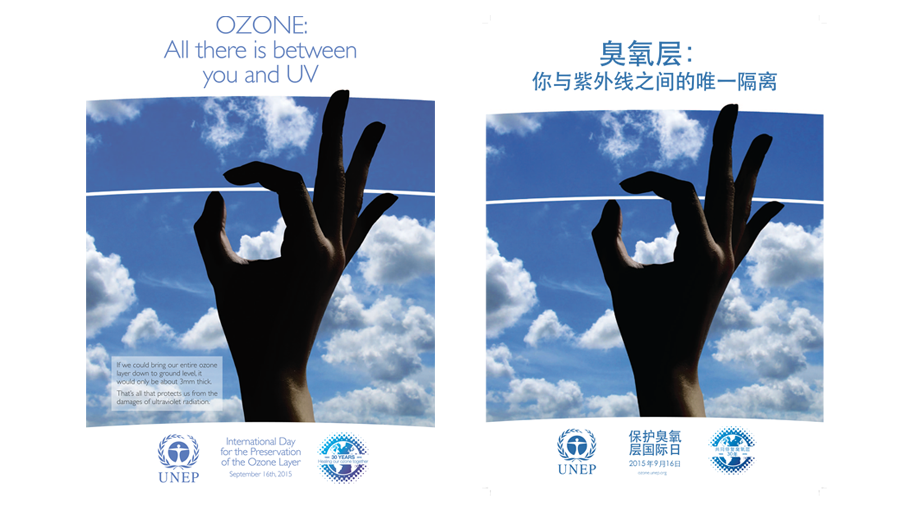
A campaign that includes a series of animations, visual images, print and online communication tools to help communicate what the ozone layer is, where it is in the atmosphere and what has been achieved under the ozone protection regime.

Thirty years ago the first images of the ozone hole created a media storm and helped lead to the Vienna Convention for the Protection of the Ozone Layer and the Montreal Protocol.

People only had to look at a picture to physically see atmospheric chemistry. It didn’t take much persuasion to convince the policy makers to take action. 

Pawan Bhartia, NASA atmospheric scientist

Carbon Visuals was honoured to be asked to create a digital campaign to communicate and celebrate the 30th anniversary of this event.  We did not want to ‘re-invent the wheel’ so we started by researching what we felt was missing from ozone communications to date.  

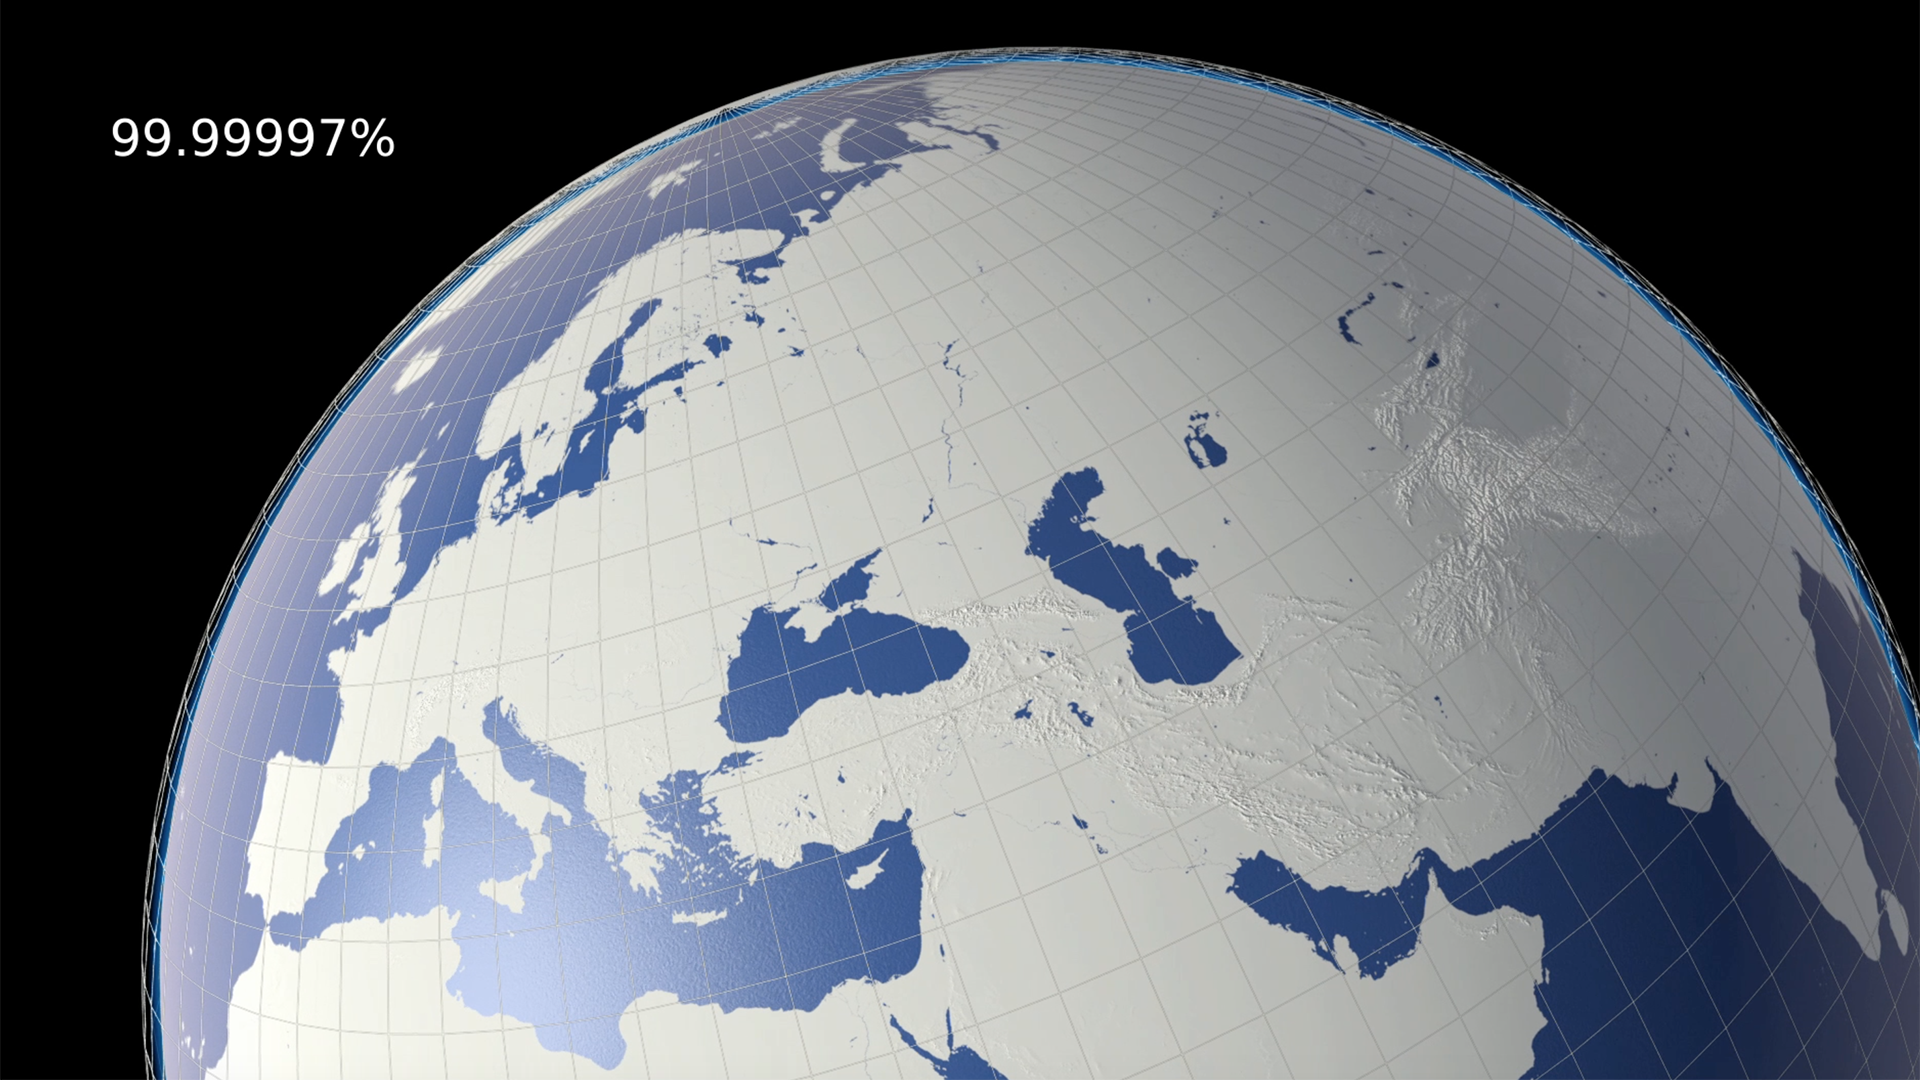
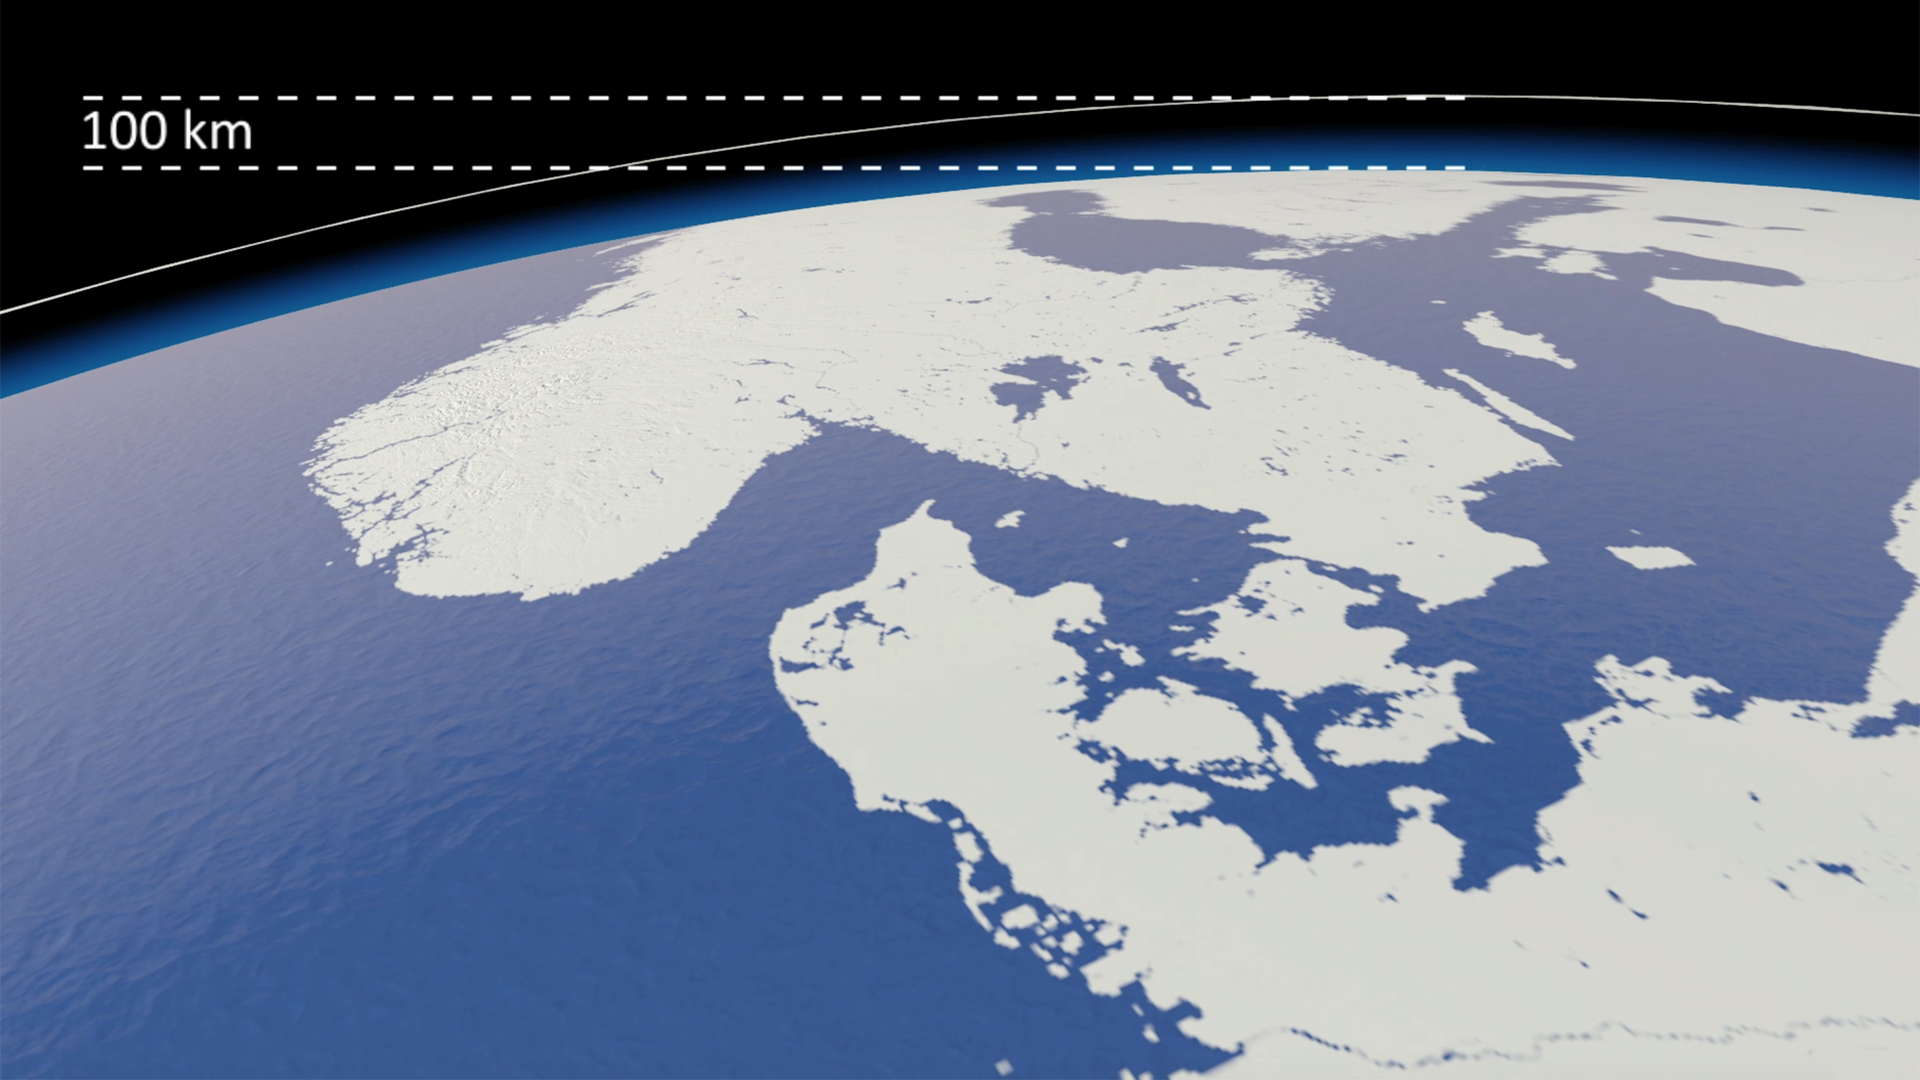
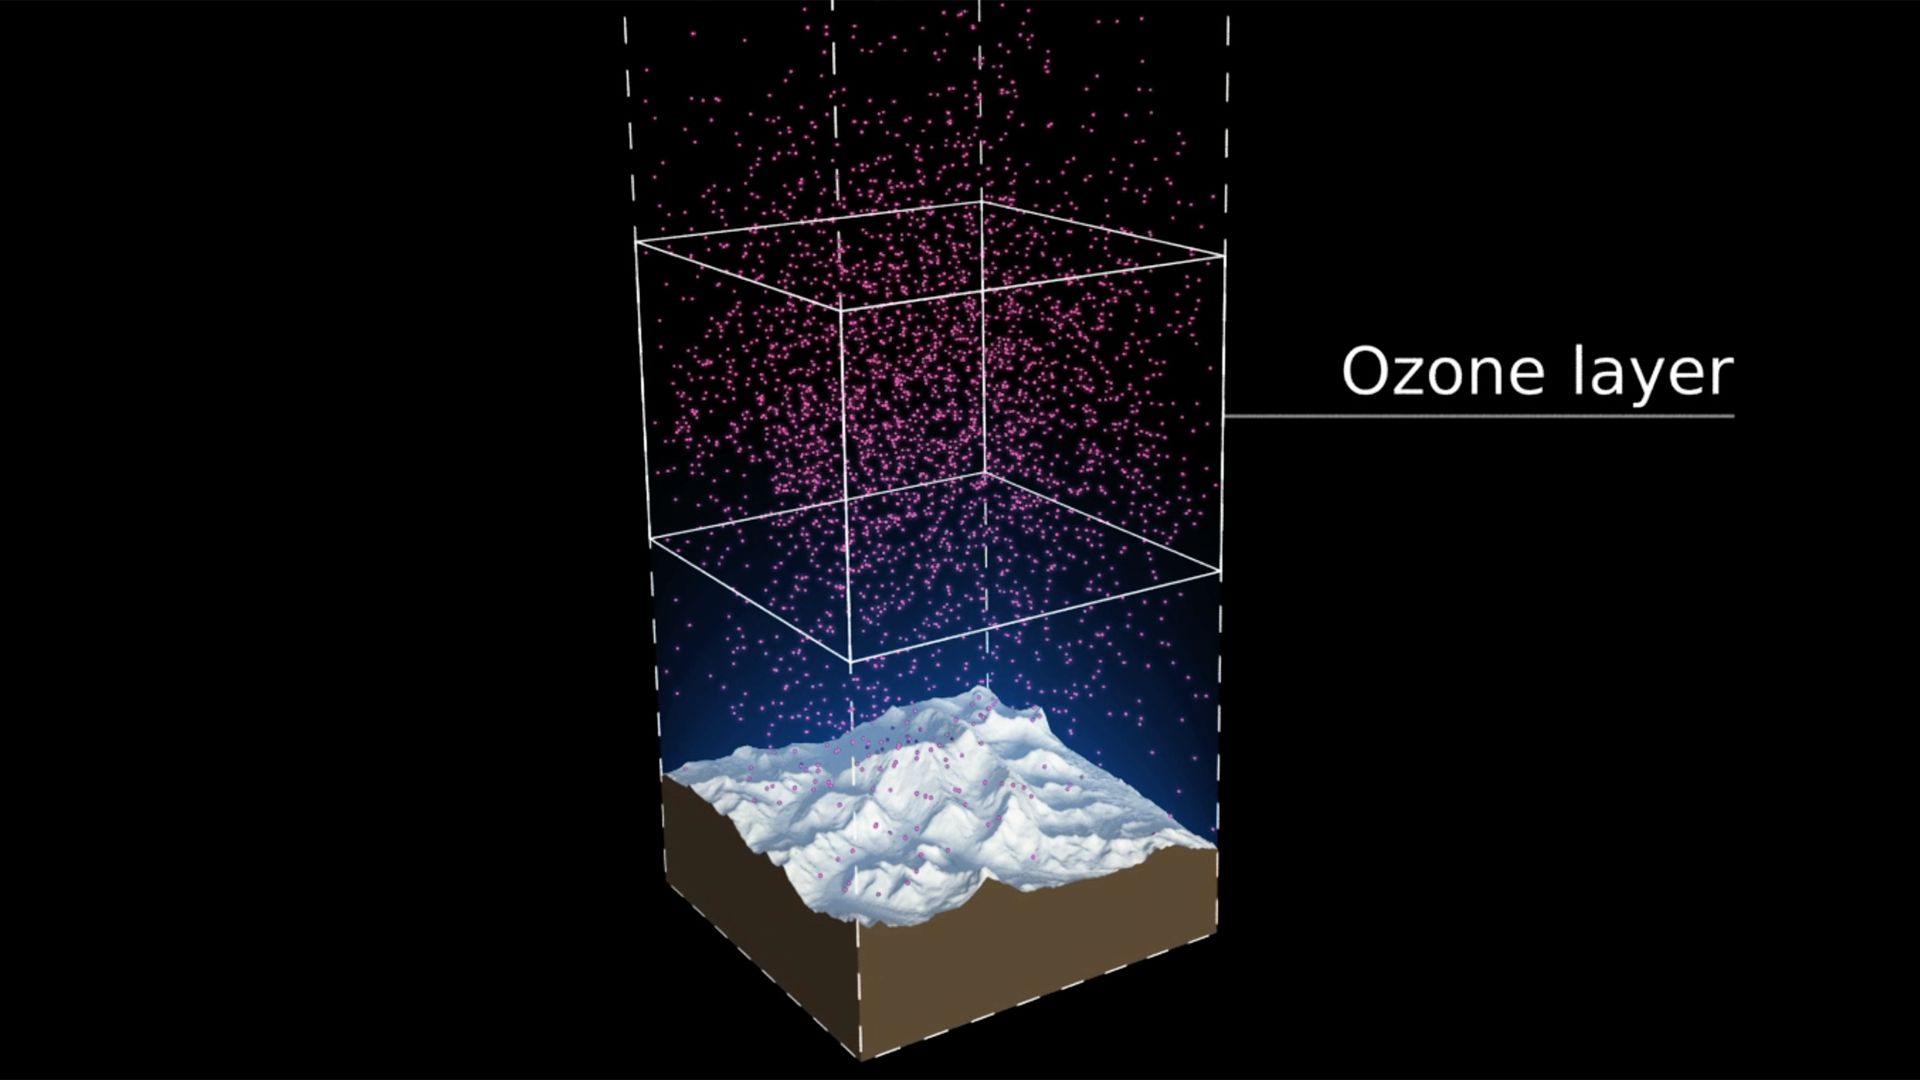
Our view was that few people have an intuitive sense of what the ozone hole is like, where it is, how much ozone there is, or how deep the atmosphere is.  So we have created a selection of visual images, animations and web-tools that help everyone from policymakers to children better understand these things.

Over the coming months different elements will be releasedalongside key events within the UNEP calendar.  This week, July 20-23, we are releasing two elements.

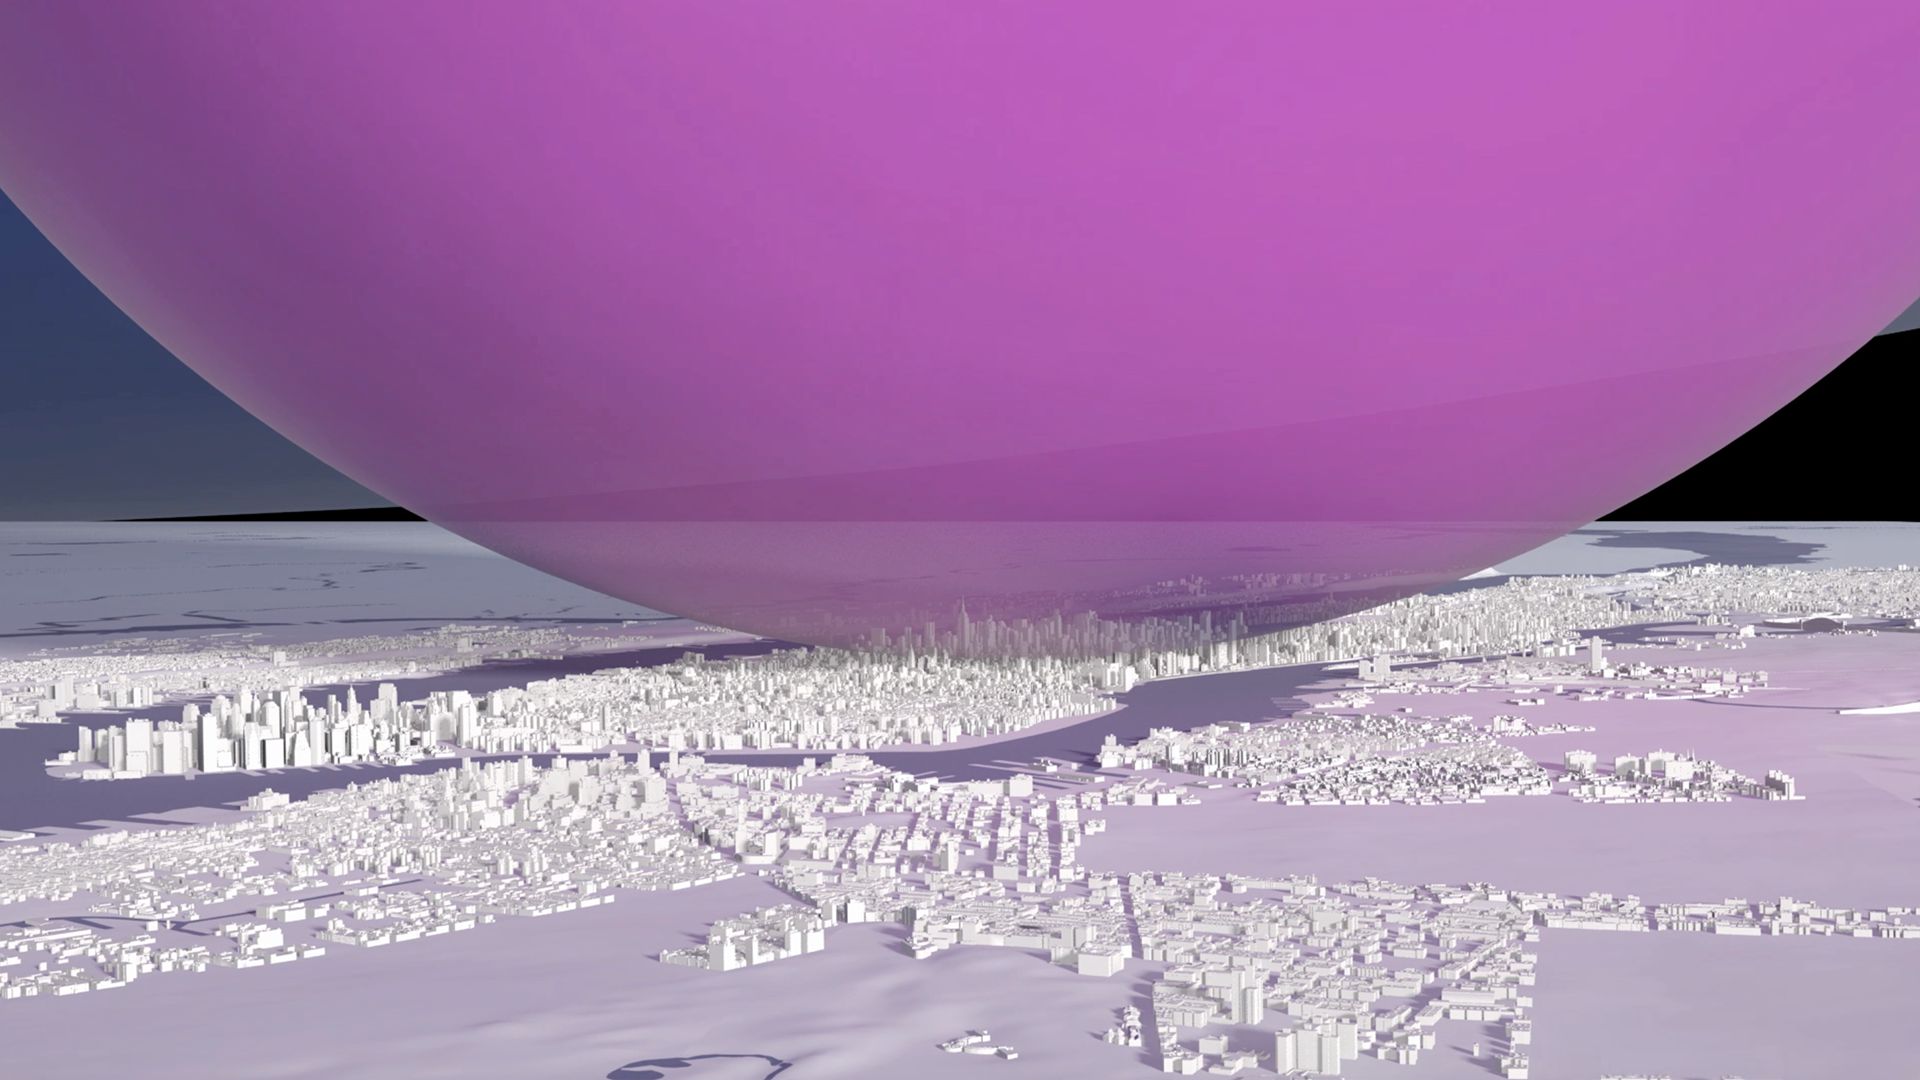
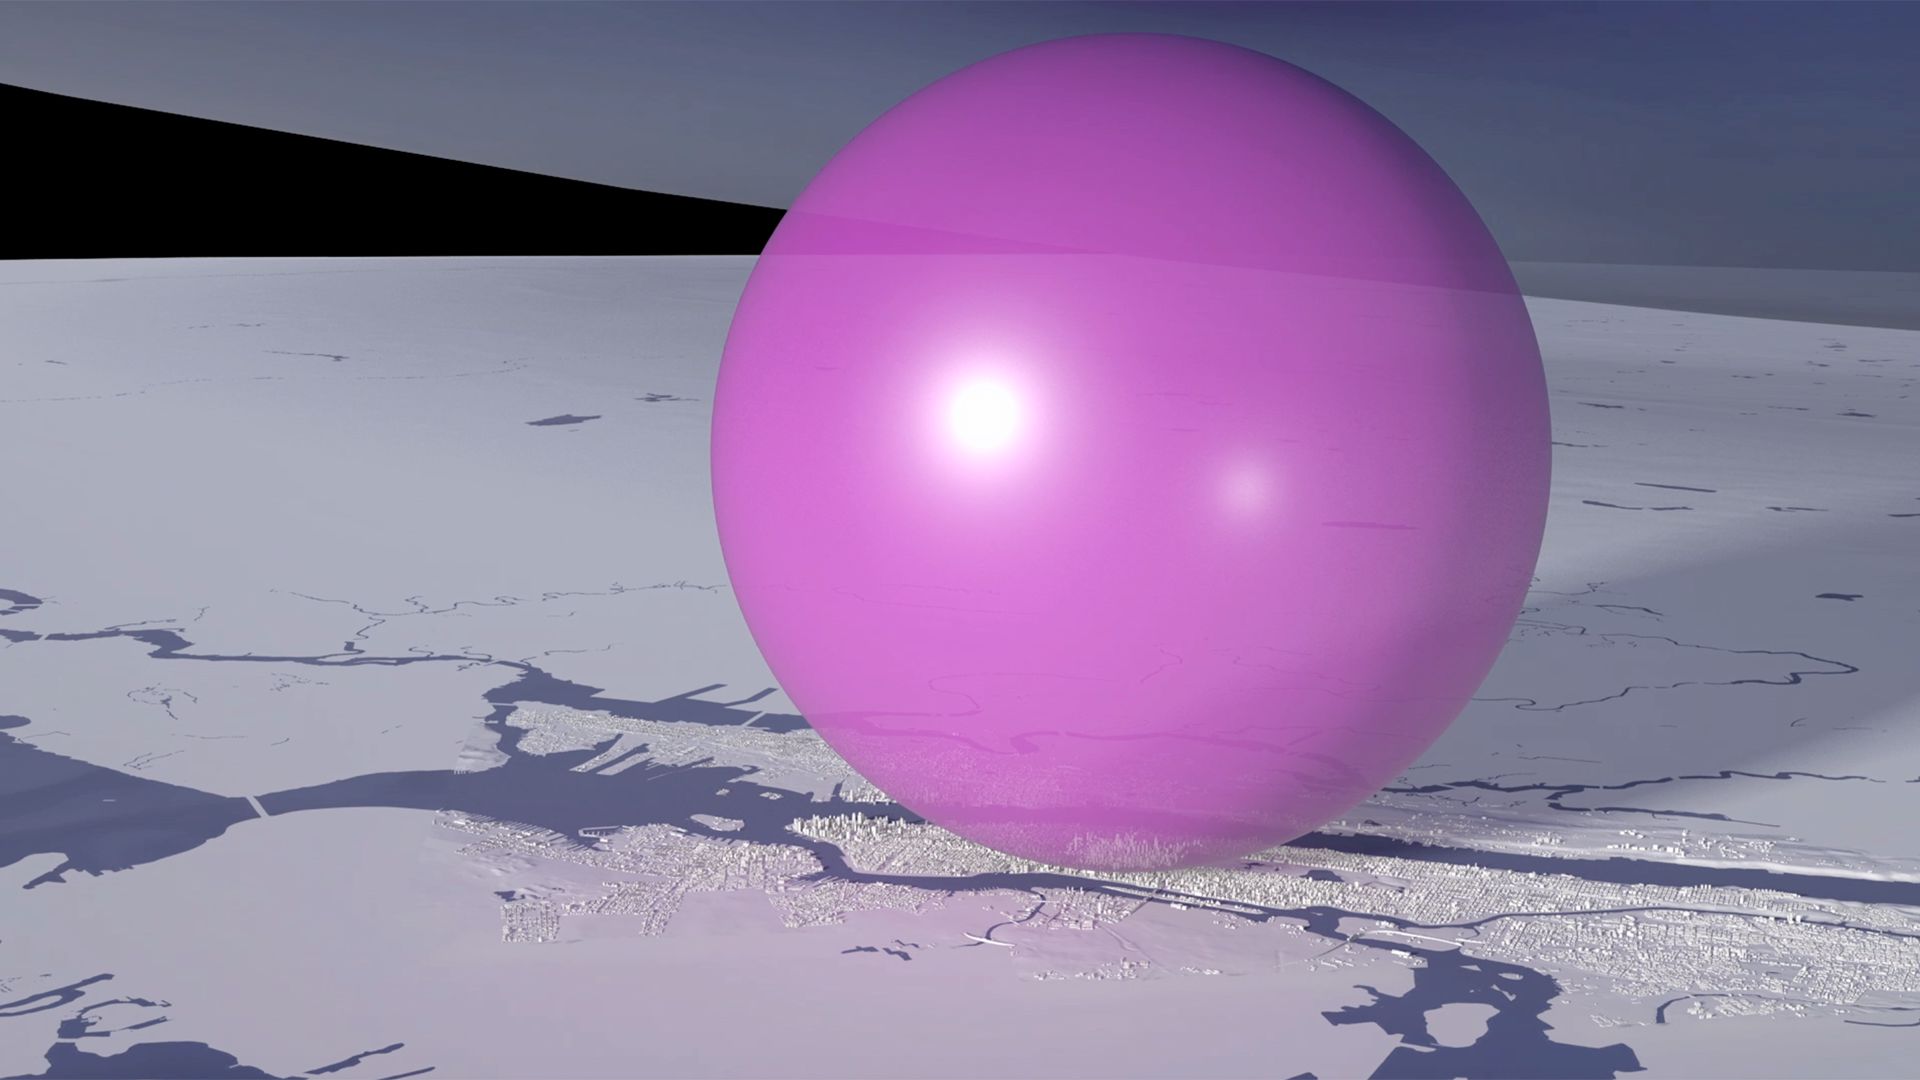
Precious ozone - the size of it

A short animation and a set of still images give viewers a sense of scale for how much air there is in the atmosphere and how much of it is ozone.  

Click here to view on Youtube.

Ozone Globe

An interactive / self-running globe that displays current ozone distribution and also celebrates each country’s ratification of the Vienna Convention.

Click here to visit the interactive


All images are available under Creative Commons licence to download on our Flickr page

UN Ozone website: http://ozone.unep.org/en/infomaterials.php

Get Positive

CLIENT

Kingfisher plc

PURPOSE

To encourage staff interest in environmental impacts and corporate goals.

DESCRIPTION

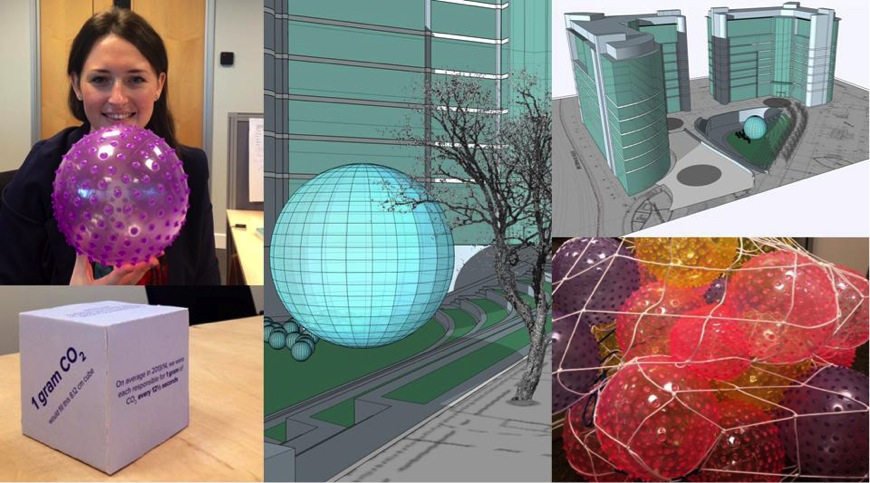
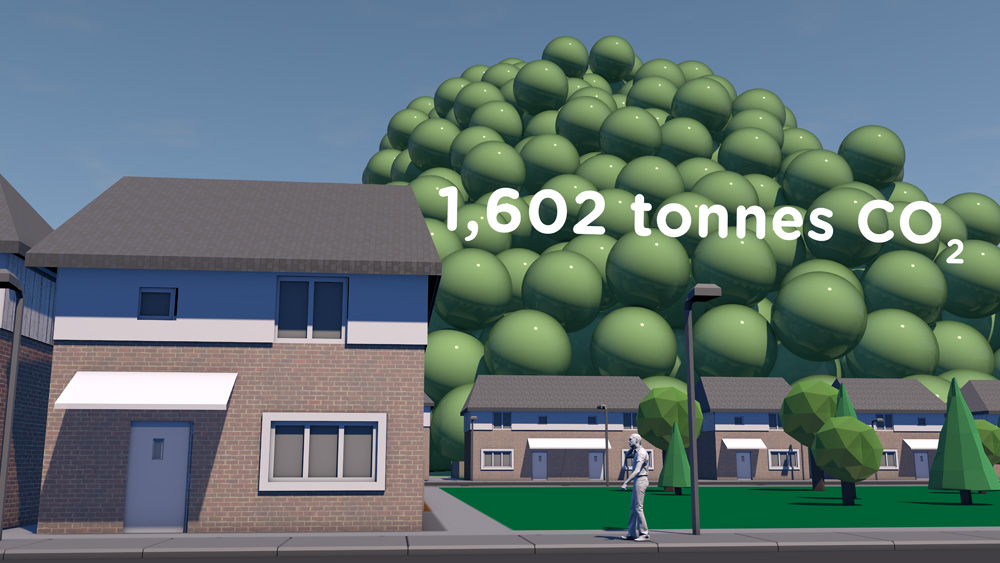
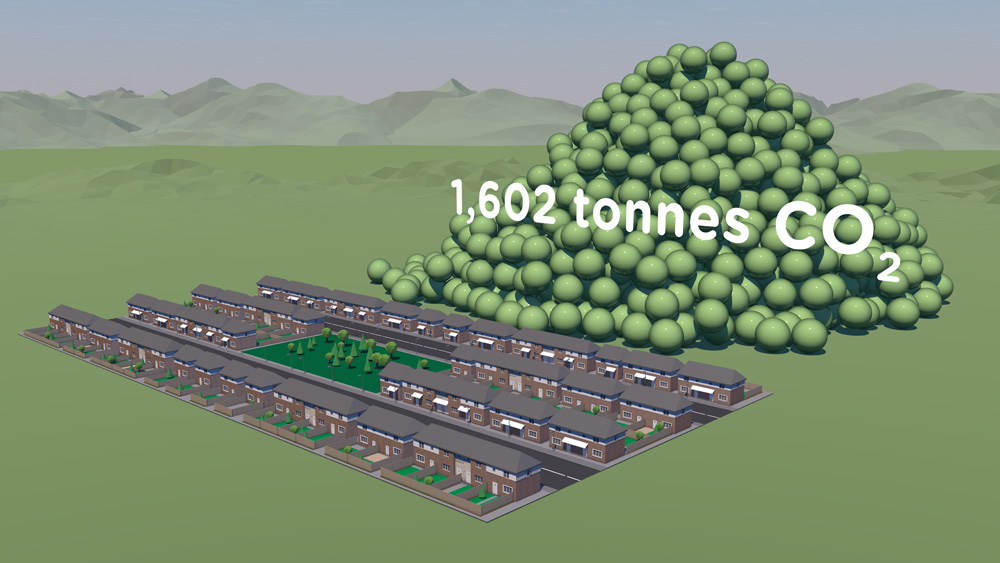
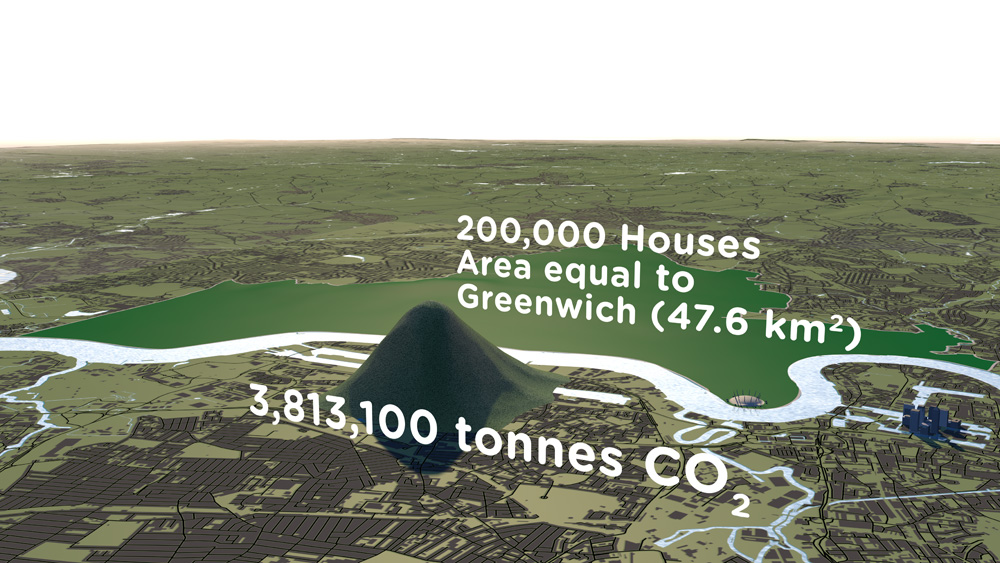
Animation, stills and physical objects using volumes, displays and fun to make emissions and paper use more tangible.

Feedback from the launch has been very positive with people really taking to the visualisation of a tricky issue.

Sinead Conway, Net Positive Delivery Manager, Kingfisher plc

International retail group Kingfisher has developed a forward-looking approach to sustainability with a long-term Net Positive goal. This involves all employees including those based in the corporate centre.
We advised on presenting key data on emissions and paper use in fun, encouraging and engaging ways to spark interest at an internal launch event.

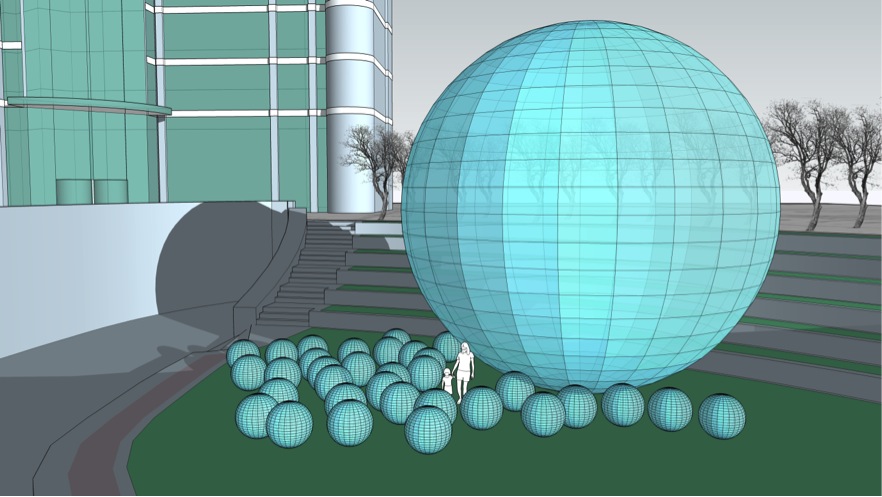
We provided a short volumetric animation set in a scene familiar to staff, and a set of cubes equivalent in size to one gram of carbon dioxide at 15°C and standard pressure. We also supplied one hour’s worth of brightly coloured balls sized to equate to emissions per person per minute and co-designed a striking display of current paper use.

Staff really responded positively to the personal element, seeing data broken down by person and in relation to familiar spaces.

Hannah Judge-Brown, Interim Programme Advisor - Net Positive, Kingfisher plc

NHM sustainability engagement

Waterhouse Building, Natural History Museum

Waterhouse Building, Natural History Museum

CLIENT

Natural History Museum

PURPOSE

To plan sustainability communications and engagement.

DESCRIPTION

Attitudinal research, energy control map, segmentation, engagement guidance and reports.

In Spring 2014 we were invited to work with the Natural History Museum on internal sustainability engagement. As with other great museums, integrating modern systems into heritage buildings and maintaining the conditions required for precious collections provide particular challenges for energy managers.

A decade previously, our founding partner CarbonSense was instrumental in the formation of the Museums and Galleries Energy and Carbon Forum which brought together managers of energy and estates from around the UK to share best practice. CarbonSense also contributed to the formulation of an Invest to Save project - the 1851 Estate Carbon Reduction Plan - and thereafter seconded a Low Carbon Manager to the Natural History Museum for two years. Subsequently, Carbon Visuals has provided a range of innovative visuals for this project and also for some of the individual partner institutions including Imperial College and the Royal College of Music.

While judicious investment in infrastructure can deliver improvements, a key to sustained progress on emissions is to also engage everyone in working together towards a low carbon future. We advised NHM on taking a strategic and evolutionary approach over a number of years. We started by conducting informal interviews with selected personnel throughout the organisation and developing a fresh, upbeat and non-technical approach to internal communication on sustainability.

Working closely with the Energy Manager, we used a unique process of energy control mapping based on assessing the extent to which employees and others can control or influence energy use and emissions, and as a precursor to setting levels of ambition accordingly. Case study areas were identified with employee profiling and segmentation. A set of desired outcomes was developed and trialled with the Environmental Group – a cross-Museum managers group charged with ensuring engagement within their own areas.

The Museum has subsequently embarked on the development of an Energy and Sustainability Strategy, including communication and stakeholder engagement, to establish a clearer focus on taking this work forward.

Carbon Visuals brings a powerful analytical approach to sustainability engagement that can be of great help in preparing internal communications, ensuring that issues can be addressed, costs and benefits assessed and a campaign launched on a sound footing.

Declan Rajasingam, Energy Manager, Natural History Museum

Making sense of carbon, trees and timber

CLIENT

Wood for Good

PURPOSE

To find a new way to communicate the carbon benefits of using wood and timber in the UK construction sector.

DESCRIPTION

A series of short animated films and case study images using Wood for Good’s data to reach construction professionals, policy makers and the public.

The competence and skill you have in handling large data sets is absolutely fantastic. And you still delivered a wonderful set of visuals for us that we can continue to use for a long time to come.

Craig White Chairman, Wood for Good

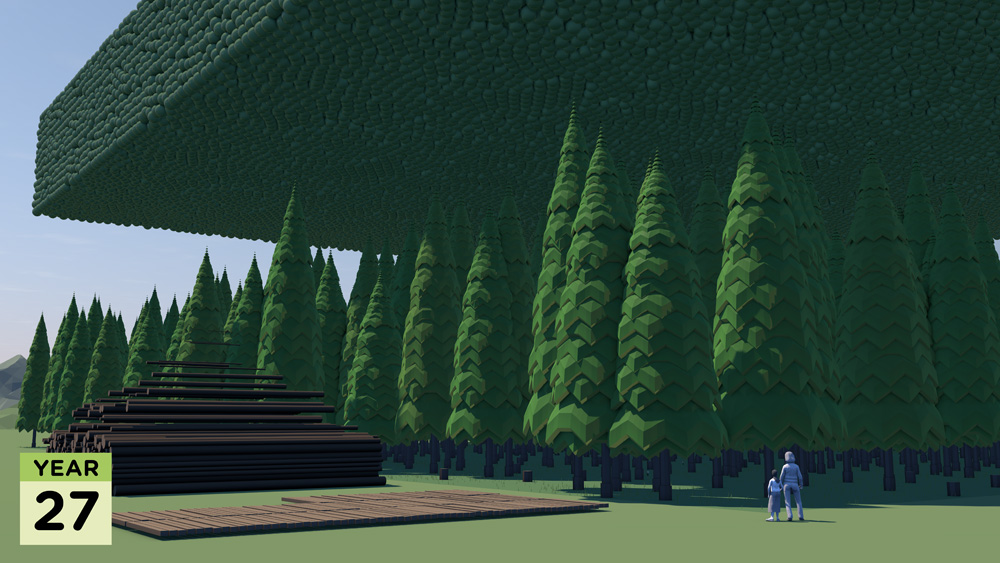
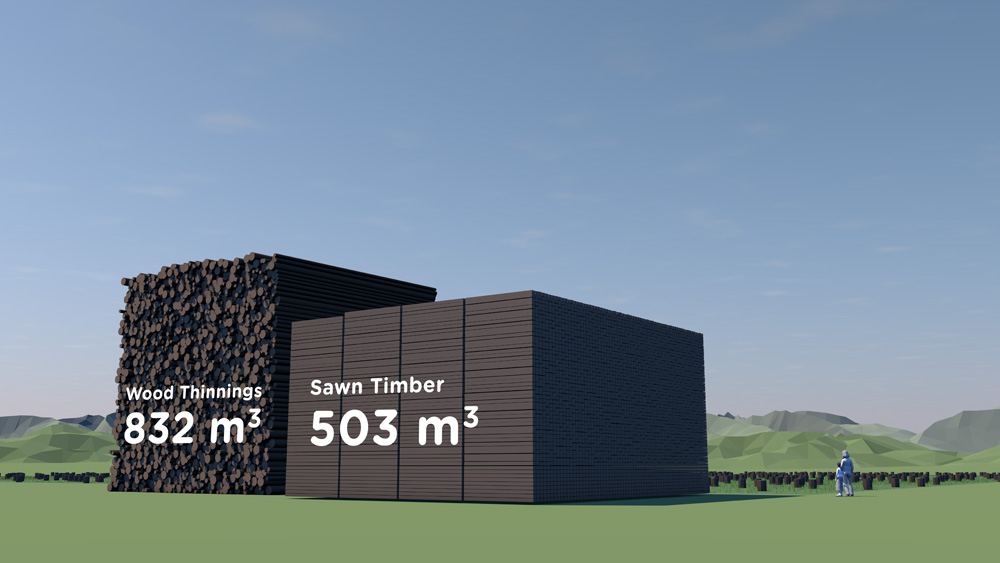
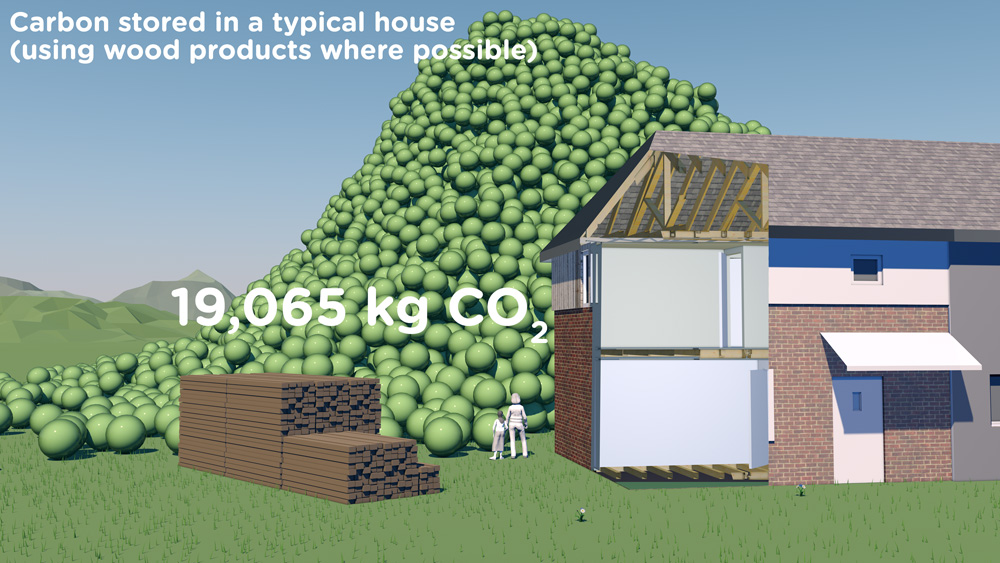
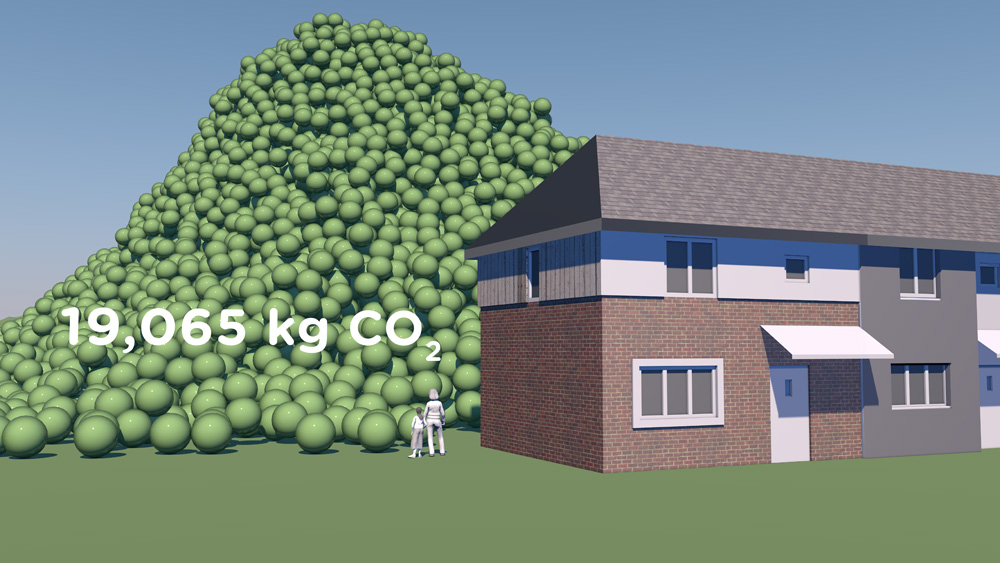
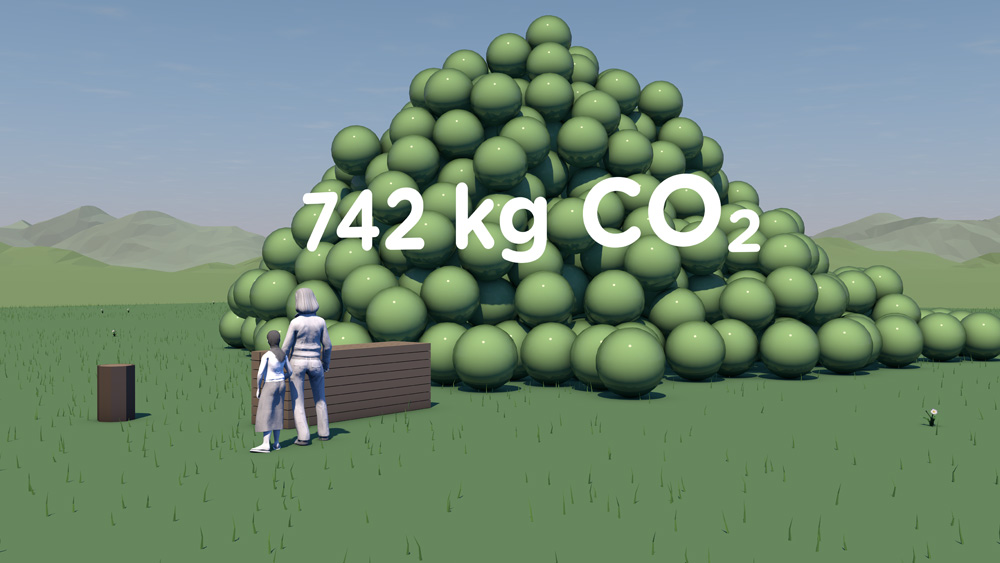
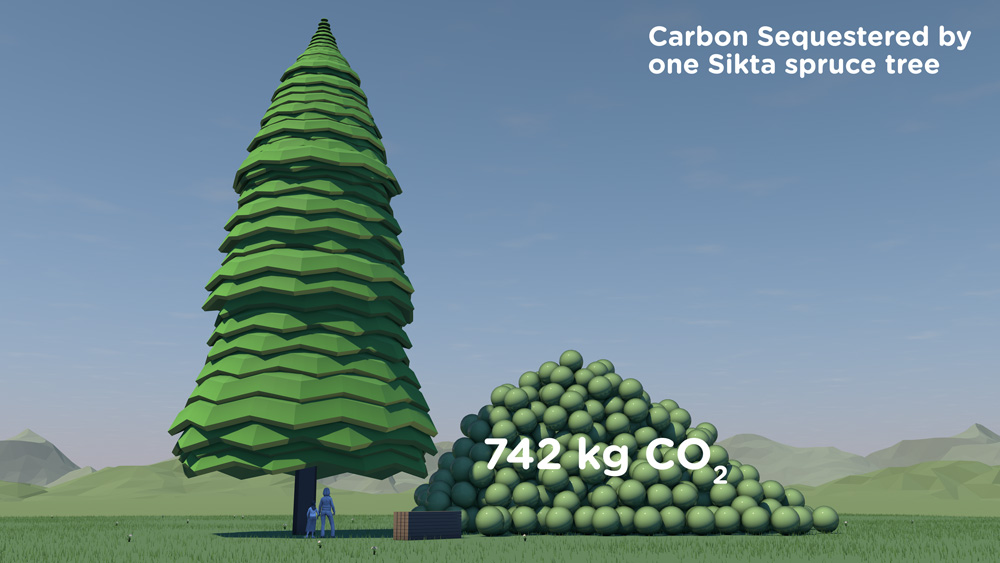
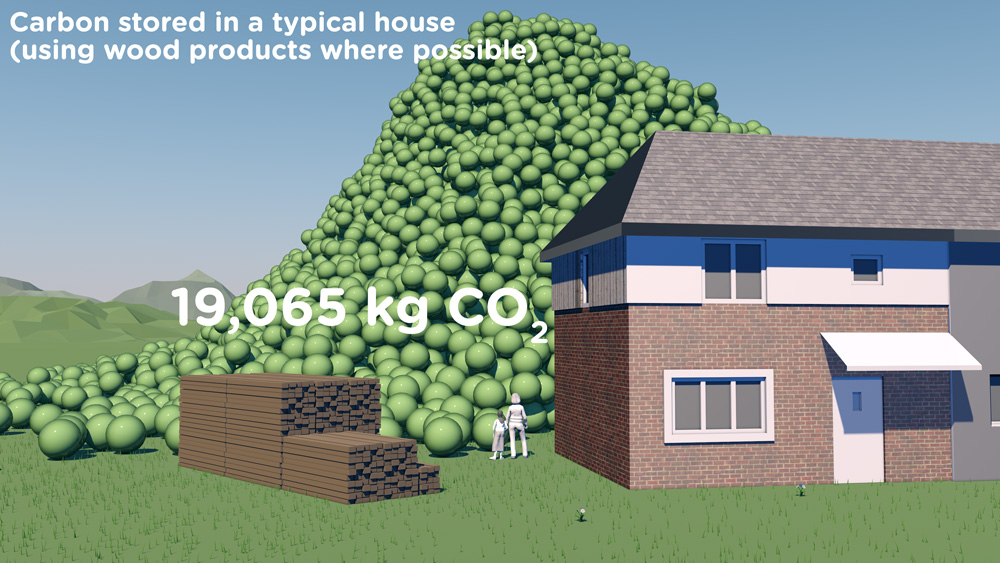
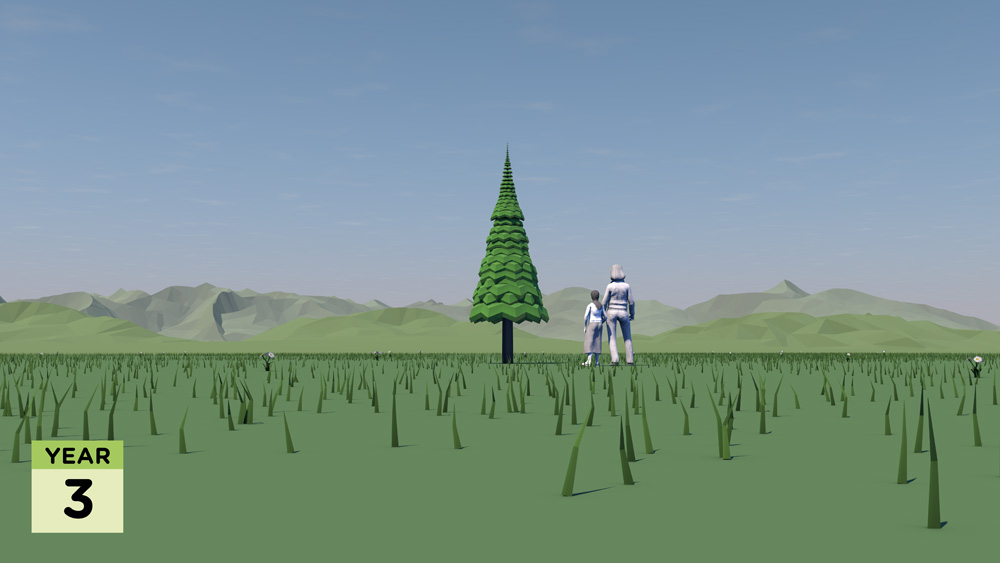
How much carbon is stored in a tree? How does that translate into cut timber and wood products? And how much carbon can be ‘banked’ by using timber for building houses in the UK?

These questions are raised and answered in a communication project that includes a series of short animated films and set of case study images created by Carbon Visuals for Wood for Good, the UK's wood promotion campaign.

The aim was to find a new way to communicate the positive carbon benefits of using wood and timber in the UK construction sector not just to construction professionals but also policy makers and the public.

Given the wide nature of the brief we agreed with the client to start the project with a scoping phase. During this, it was decided to split the film into three separate sections that could each work as short stand-alone films, rather than only as one single complex narrative. In addition we agreed to create a set of case study best practice images showing the carbon ‘banked’ in high profile buildings and timber products.

It has been very satisfying to shape and create a project which has both a business focus and important educational potential. I would like to see us working with more trade bodies and campaigns that have an important carbon message to get across.

Antony Turner, CEO Carbon Visuals

By liaising closely with the client in this initial phase we were able to spend time working up a communications plan, sourcing and examining appropriate data and creating draft film storyboards. This established a sound basis for the production schedule, culminating in all visual materials being ready for the campaign launch.

Data Sheet with methodology, data and references available here.

See Wood for Good website page here.

See our post-production video (giving insight from our clients on the project) here.

Real-time Energy & Carbon Displays for Devon Visitor Centre

Carbon Visuals has created real-time energy and carbon visualisation displays for a new Visitor Centre at Occombe Farm, a working organic farm that includes an award-winning farm shop, a cafe featuring local food and drink, a nature trail, an education centre and cookery workshops.

The carbon footprint of one hour's TV production

CLIENT

BBC

PURPOSE

To illustrate the emissions resulting from TV production for an industry conference at White City.

DESCRIPTION

Animation that shows the real-time emissions associated with making one hour of broadcast ready production, and image set.

The television industry is taking steps towards addressing sustainability issues associated with TV productions. A key tool, created by the BBC and made available through a partnership with BAFTA, is Albert - a bespoke carbon calculator.

Carbon Visuals was commissioned by the BBC to produce a set of images and a real-time animation showing the emissions resulting from one hour of TV programming. The data was provided by about 80 productions that were the first to use the Albert calculator at the BBC.

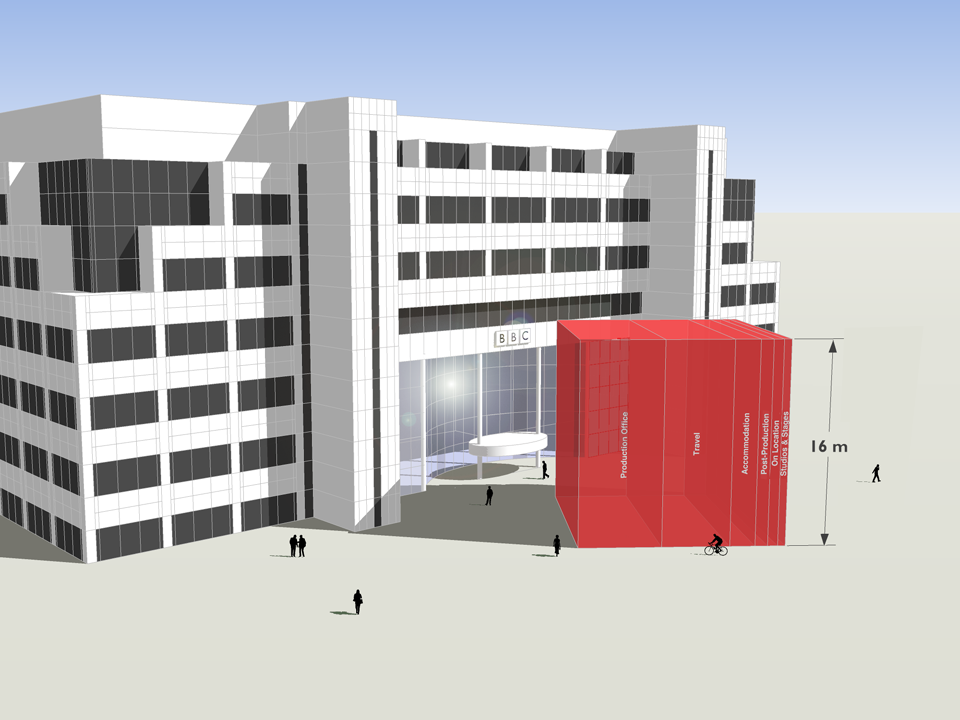
This animation was created for the BBC and shows the real-time emissions associated with making one hour of broadcast ready production - equivalent to about 8.2 tonnes of carbon dioxide.

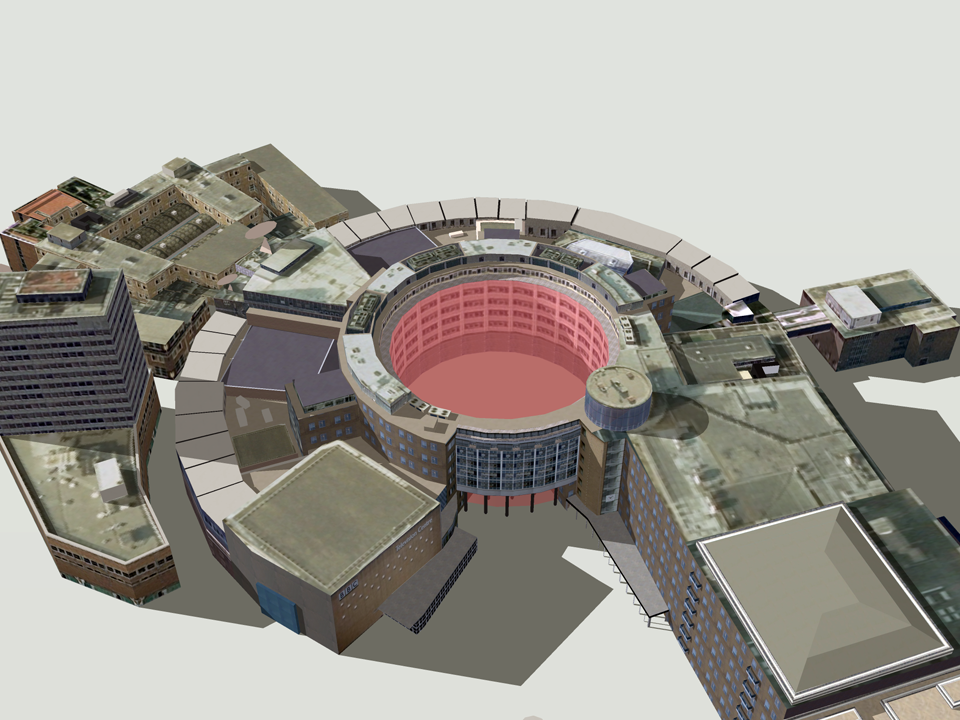
Average emissions associated with the major stages of a production are here shown in order of size and as a whole, depicted in front of the BBC White City building.

These visuals were first shown at an industry conference, which took place in the iconic BBC White City building that is depicted here, on 3rd November 2011.

The PDF illustrates the emissions of different parts of the production process.

Albert was developed & trialed within the BBC in 2011, with production managers and coordinators providing data on about 80 programmes. While there were considerable variations between productions, the average (mean) rate - about 8.2 tonnes of carbon dioxide per hour - provides a first attempt at establishing a figure against which programme makers will be able to gauge progress in future.

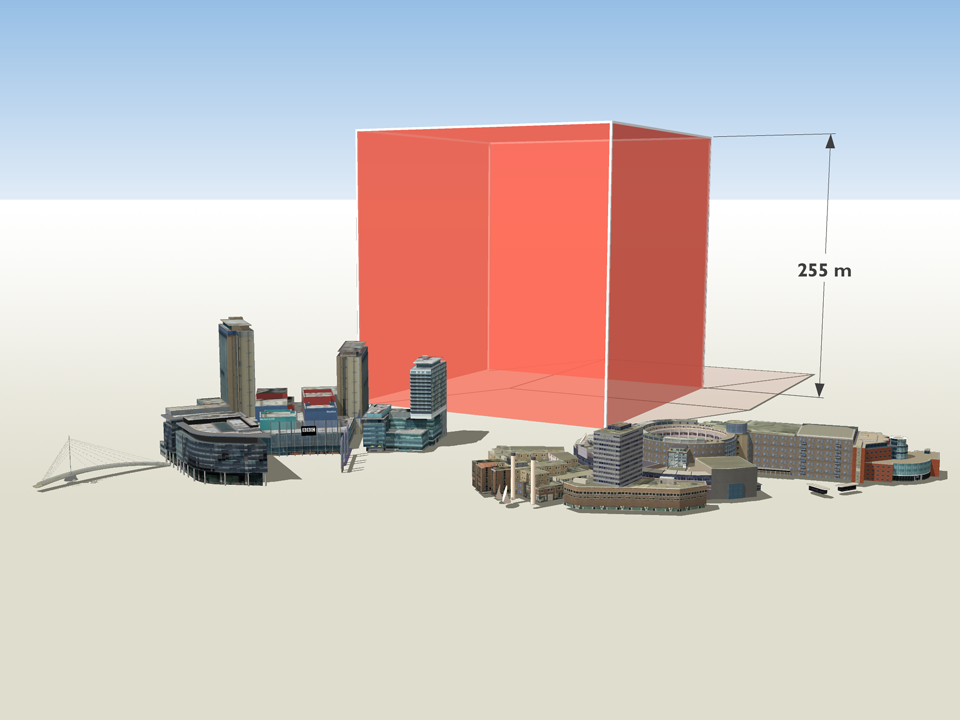
Annually within the BBC, about 3,800 hours of TV are produced in-house. An annual volume of emissions, based on the average rate per production hour for programme emissions calculated using Albert, is here shown with familiar BBC buildings in Salford and London for scale.

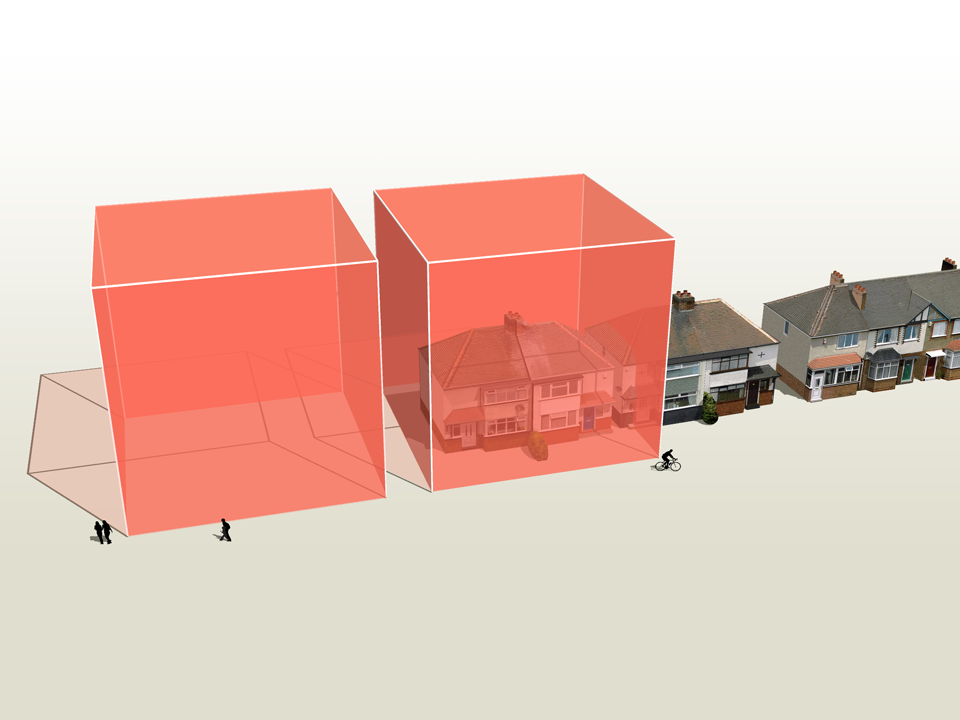
The average (mean) rate of emissions associated with TV production, based on data from about 80 programmes, is about 8.2 tonnes of carbon dioxide per hour.

This is roughly equivalent to the annual emissions associated with space heating, heating and lighting for a pair of semi-detached houses (figures provided by the BBC).

Based on the average rate per production hour for programme emissions, 11 hours of production time would fill the void in the centre of the BBC Television Centre in London - a space that is well-known to production teams.

Illustrating carbon reduction potential for South Kensington 1851 Estate

CLIENT

Natural History Museum, Science Museum, V&A, Imperial College and Royal Albert Hall

PURPOSE

To illustrate the carbon reduction potential for the South Kensington 1851 Estate.

DESCRIPTION

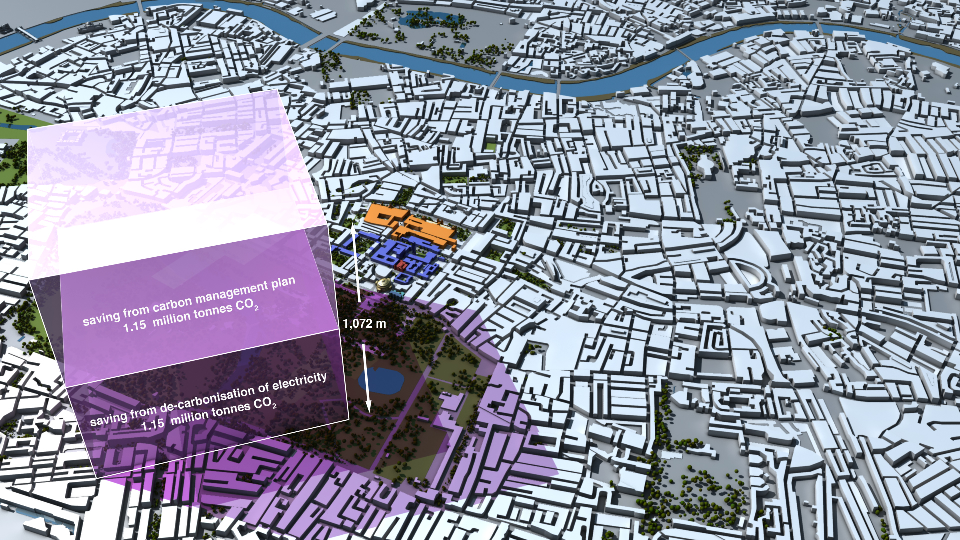
Striking image set, to illustrate the Carbon Reduction Masterplan launched by the Minister of State for Energy and Climate Change.

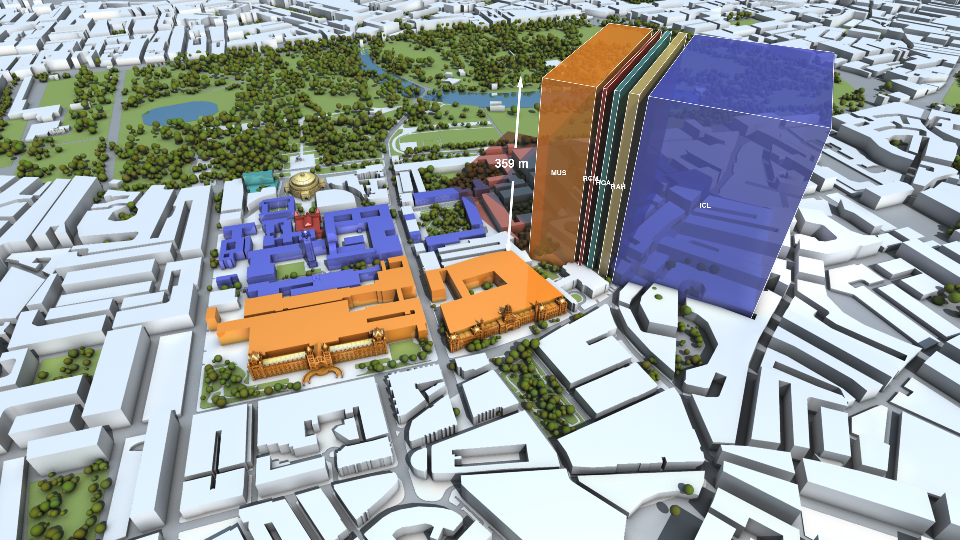
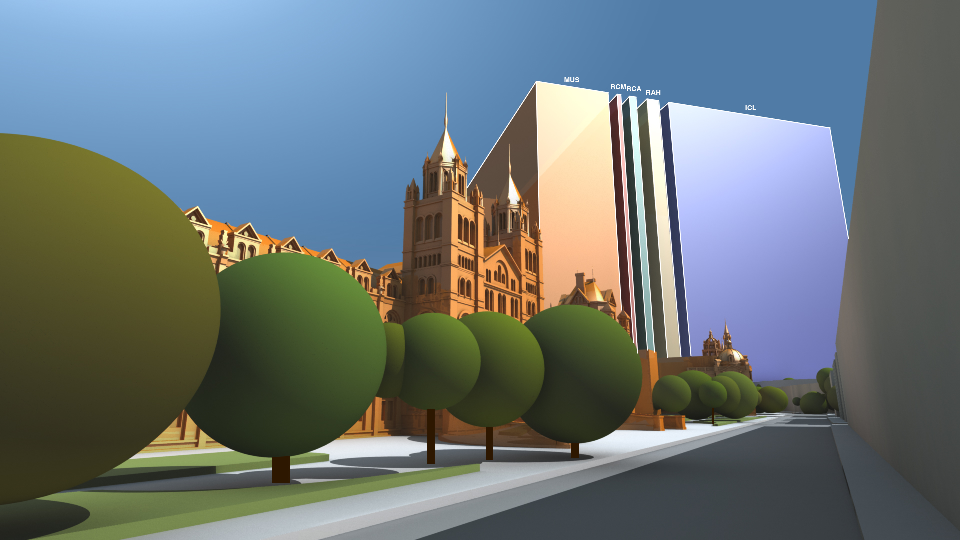
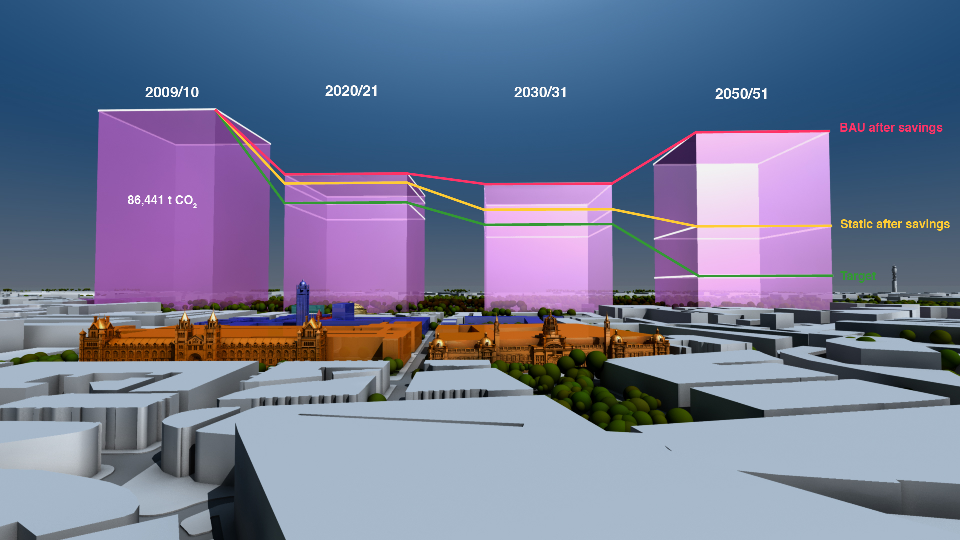
Carbon Visuals has created a set of striking images to illustrate the carbon reduction potential for the South Kensington 1851 Estate. Organisations involved include the Natural History Museum, the Science Museum, the Victoria and Albert Museum, Imperial College, the Royal Albert Hall, the Royal College of Music and the Royal College of Arts.

These prestigious institutions came together in 2005 to embark on an inspirational long-term carbon reduction plan. Phase One involved laying the foundations and creating a realistic strategy. The Masterplan, launched in November 2011, marks the conclusion of that phase and the commencement of its realisation.

Carbon Visuals aided communication amongst the parties and with external stakeholders by creating striking imagese at various stages of the project.

Creating a computer generated model of the Estate enabled a wide range of different images to be created - wide angle, close-up, aerial and ground level.

To see the context in which the images were used feel free to download the PDF of the overview brochure.

Supporting BP's interactive carbon calculator for motorists


CLIENT

BP

PURPOSE

To encourage motorists reduce emissions from driving.

DESCRIPTION

Consultancy and visuals for a web calculator showing actual volumes of CO2 which change in size as reduction actions are chosen, with image set and methodology.

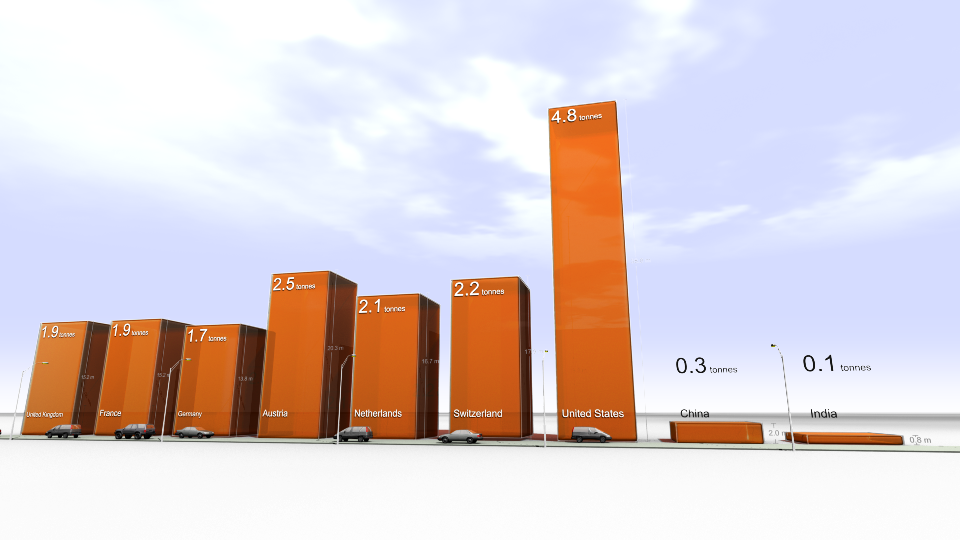
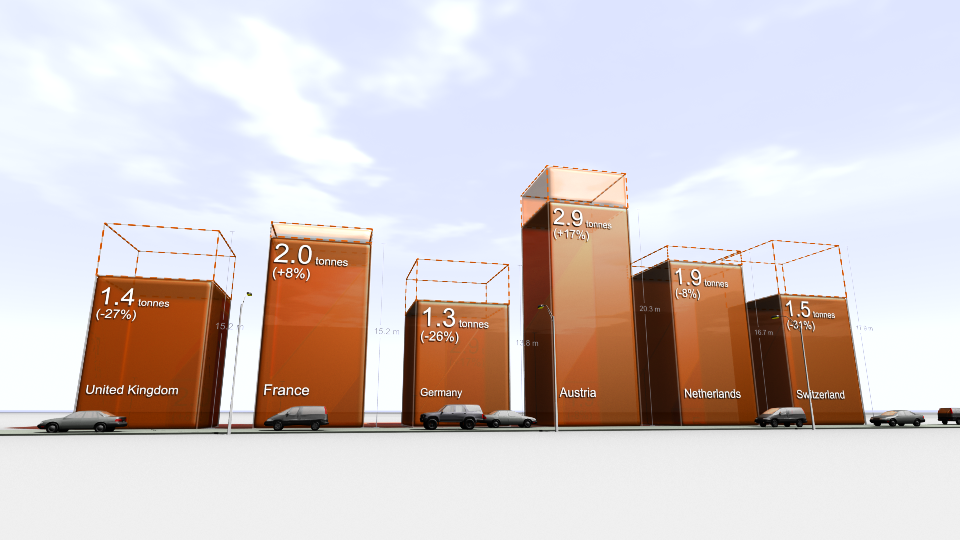
Carbon Visuals helped newly re-launched BP Target Neutral project by providing consultancy for the web calculator designed to help motorists reduce, replace and offset carbon dioxide from driving. The calculator, aimed at the general public, is the first in the world to show actual volumes of CO2 which change in size as different reduction actions are chosen. In addition carbon spheres can be compared against averages for other countries as well as the UK 'target' reduction for 2050.

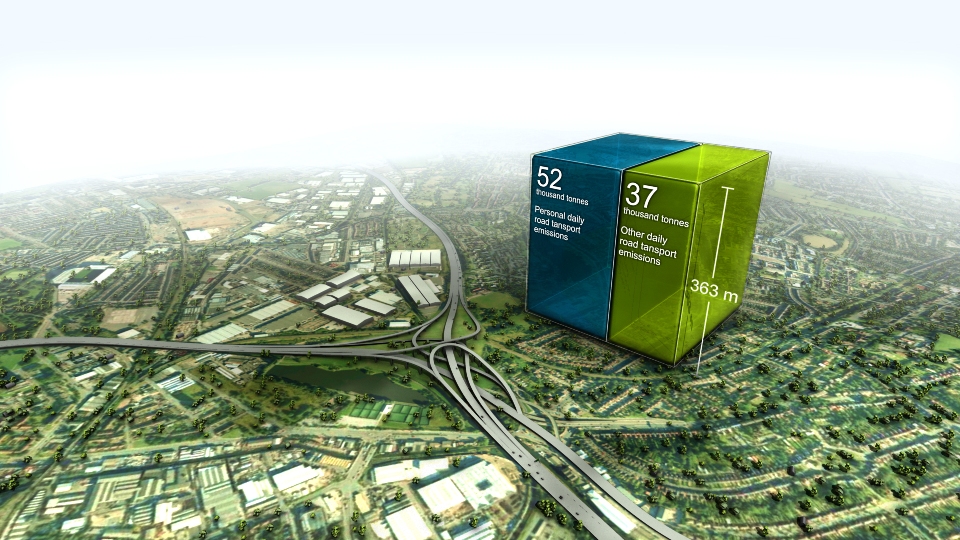
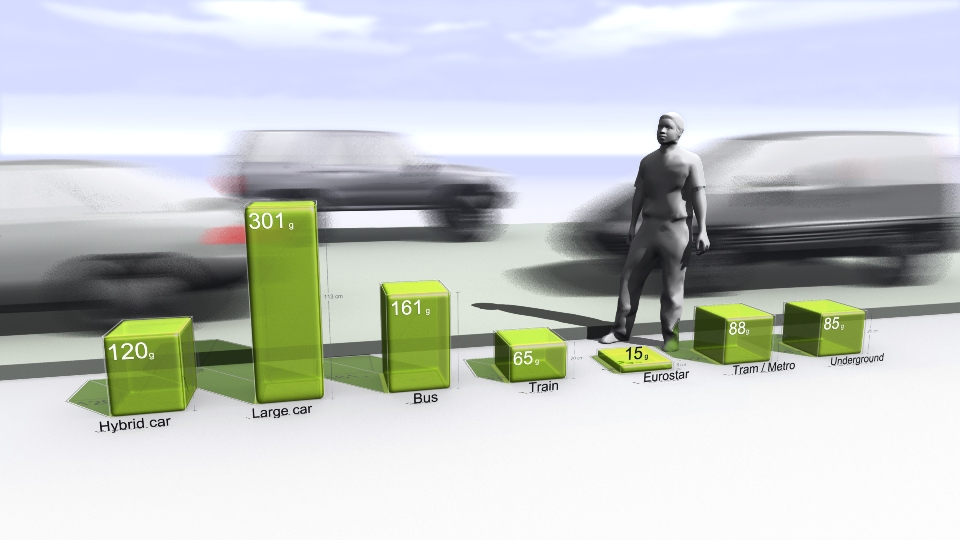
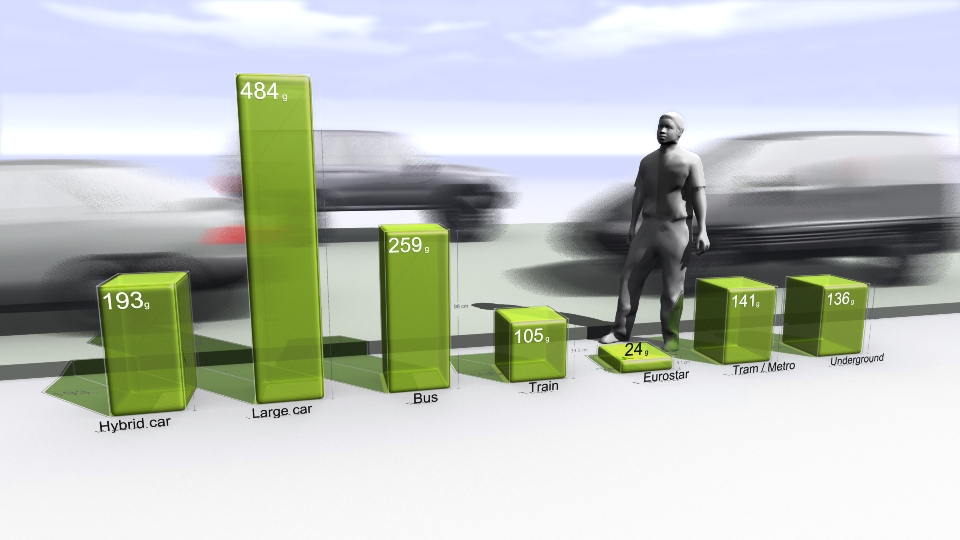
We also provided a number of bespoke images to highlight transport emissions in the UK, emissions of different transport types as well as transport emissions per capita for different countries.

Our Creative Director, Dr Adam Nieman also provided an overview of the importance of carbon visualisation

The first visual image uses Spaghetti Junction on the M6 near Birmingham as this basic ground. The familiar image from the British road network makes the immediate point that this is about roads, but then uses the recognisable scale to locate a cube-like shape showing the volume of carbon our cars, lorries and buses put into the atmosphere every day.

The cube presents this visually, while the simple captions fill in the specific details. This, the image is saying, is what 90,000 tonnes of carbon dioxide look like, and that’s what we’re pumping into the atmosphere every day. Suddenly the daily figure is something real and dramatic.

The BP Target Neutral Methodology PDF outlines the data, calculations and assumptions in the image set.