Education

University of exeter trials Emissions Visualiser

CLIENT

University of Exeter, UK

PURPOSE

To reduce the environmental impact of the University of Exeter by raising awareness of energy use and carbon emissions and encouraging energy-saving behaviour and actions.

DESCRIPTION

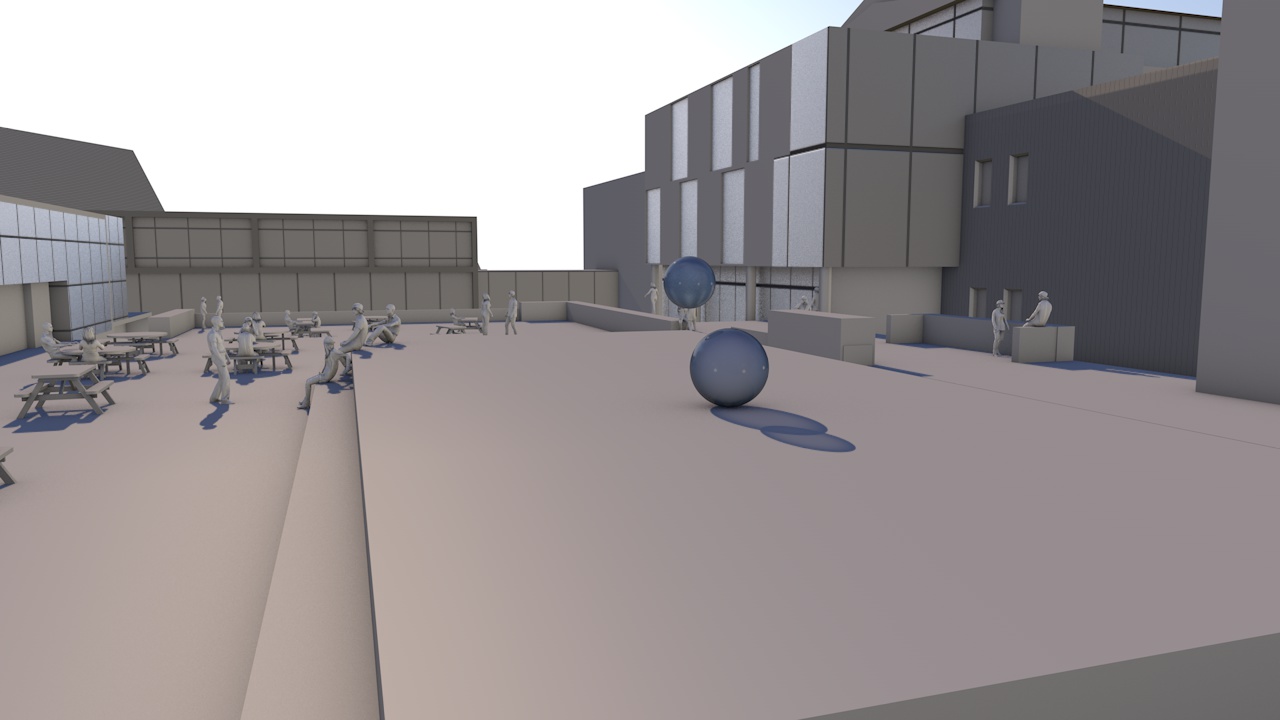
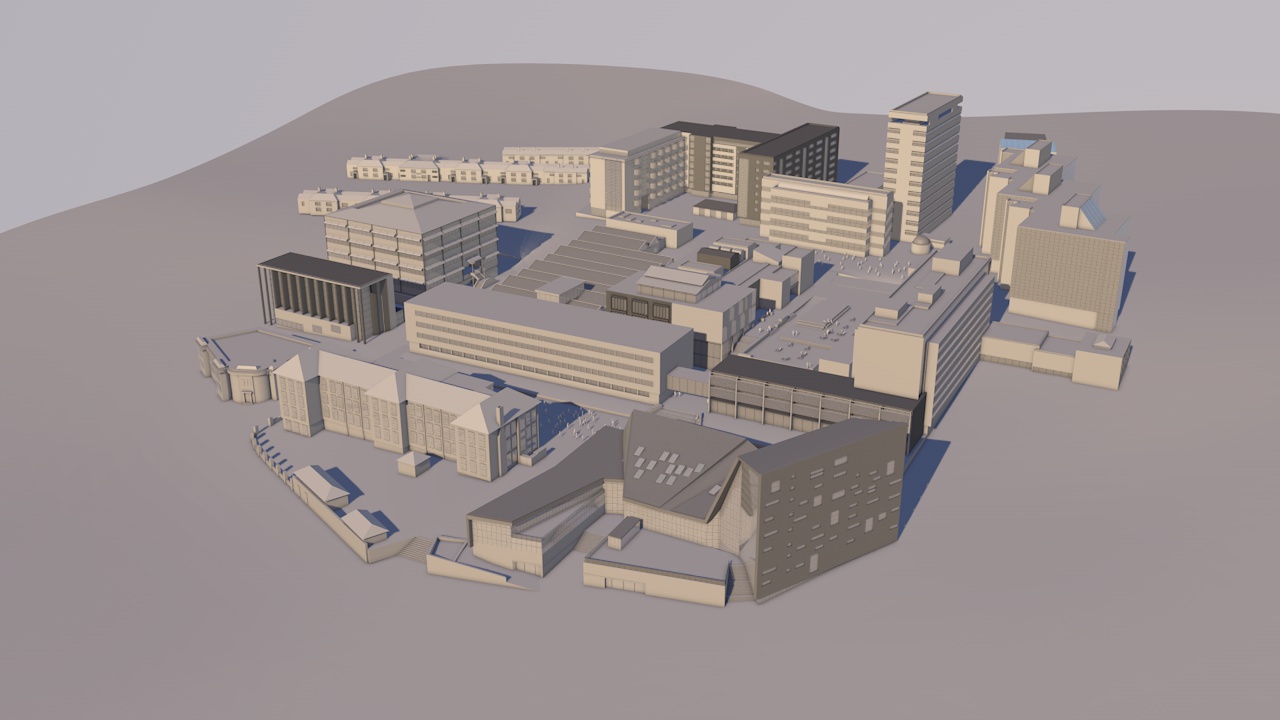
A prototype interactive web-tool and animation that presents energy data in a way that could help academics, staff and students understand the environmental impact of all 120 buildings on the two campuses at Exeter University.

The university has set an ambitious carbon reduction target of 43% by 2020 based on emissions in 2005/2006.  Achieving this reduction is going to be a challenge for the University as it continues to grow and provide quality facilities for teaching, students, research and staff.

The estates department wanted to see if Carbon Visuals could create a web-based interactive that would engage people on campus in the energy consumption and carbon footprint of all the buildings in a non-technical and visual way.  Initially sized for running on tablets, the prototype tool runs on desk-tops and mobile phones with modern browsers.  The inclusion of social media links allows images and information to be shared and opens the way for more dialogue with the Estates Department.  

In order to raise interest in the web-tool we also created a simple animation and VINE showing the total real-time carbon emissions of the university.  

The effectiveness of the web-tool will now be tested with groups of students, academics and appropriate staff.  Note that at present the Projects tab for buildings has not yet been populated. 

A similar prototype tool, animation or overview visual can be created quickly and economically for any university, college or estate - anywhere in the world.  We are currently looking for up to six additional universities who would like to pilot this communication method.

To find out more contact:  Antony Turner +44 (0)7973 641131      antony.turner@carbonvisuals.com


ENGAGED AND NON-ENGAGED AUDIENCES

We specialise in reaching non-engaged audiences. People who do not feel ownership of the data you present and do not come to the data with prior questions of their own are what we call non-engaged audiences. They have very different needs from other audiences for data visualisation, but the distinction is often ignored. Most data visualisation is created as if the audience already understands the significance of the data and are keen to explore it.

Engaged audiences include building managers and people charged with reducing environmental impact or cutting costs. To present energy data or emissions data to these audiences, graphs and other abstract representations are appropriate. These audiences already know what they are looking at  they just want to scrutinise it for any trends that can provide insight or hints for improvement.

This text is from our blog that provides the rationale for this interactive tool.  

Past, present and future - Oundle School

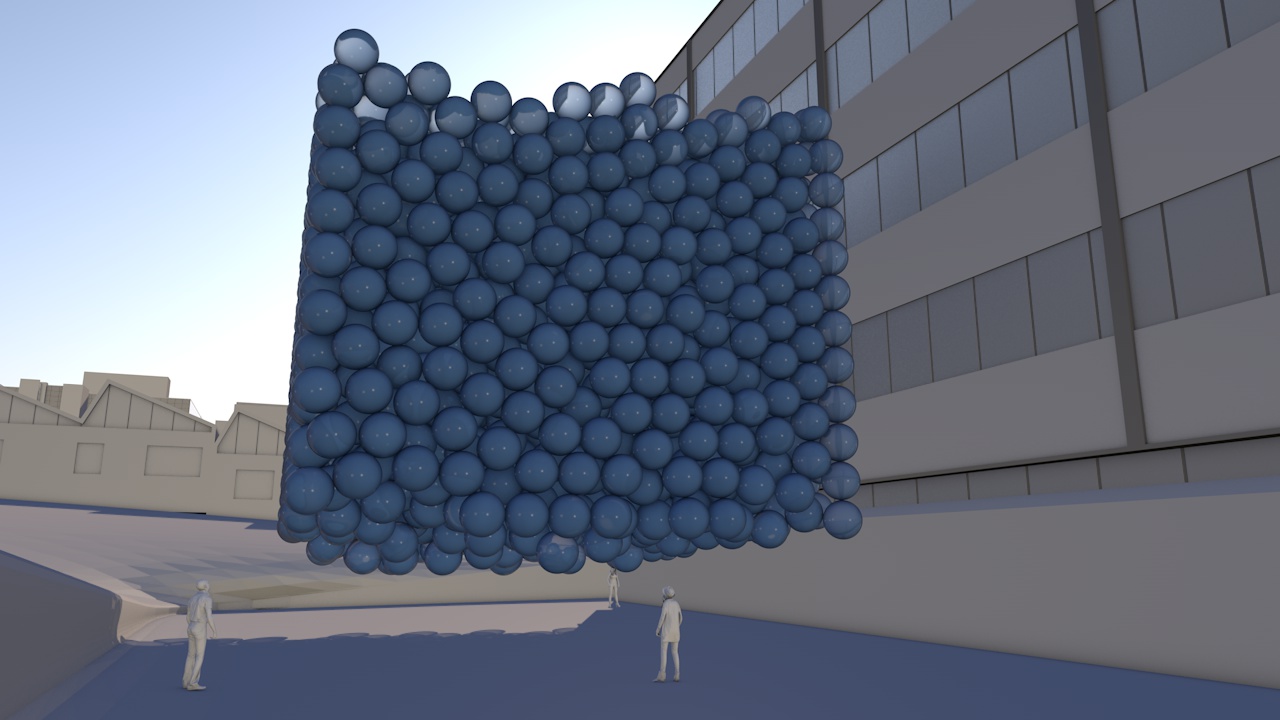
Water used in one minute

Water used in one minute

CLIENT

Oundle School

PURPOSE

To assist the environmental engagement of staff, pupils and others.

DESCRIPTION

Package including a report and 17 sketches.

Oundle School dates back to 1556 when Lord Mayor of London Sir William Laxton endowed and re-founded the original Oundle Grammar School, of which he was a former pupil.

Early in the 20th century, Oundle gained a reputation for science and engineering which has continued to this day with the development of SciTec, a major new science complex. As new and growing 21st century issues increasingly come to the fore, we were delighted to receive an enquiry about whether we could help with the engagement of staff, pupils and others to reduce environmental impacts and, potentially, utility bills too. This provided us with an opportunity to test how we could offer real value within the bounds of a limited budget.

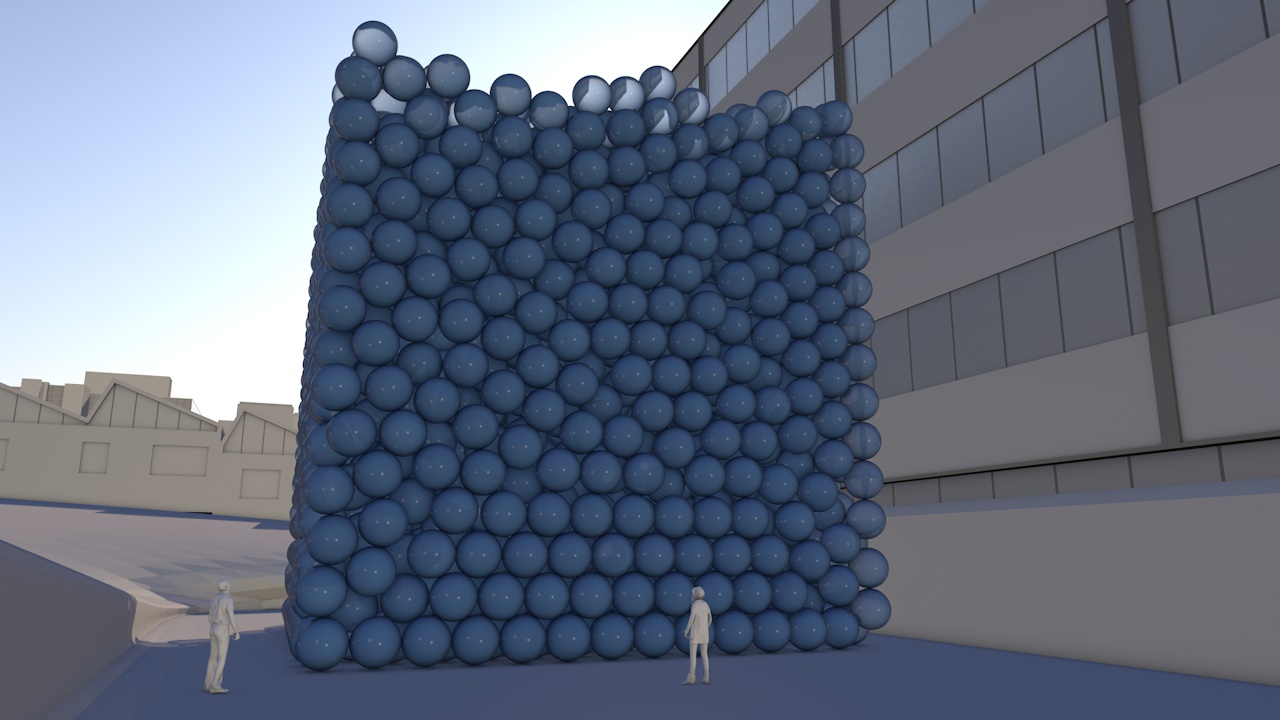
Working with just five annual figures from the School – gas, electricity and water use, waste to landfill and the School population, we were able to provide a bespoke package. Our illustrated report Ways of seeing Oundle’s impact sets out calculations, reference sources, coefficients and assumptions, a compendium of facts, some surprising and memorable examples of energy equivalence and answers to a set of FAQs. Seventeen accurate volumetric sketches show emissions and water use over periods from a second to a year.

We got boarding house consumption of electricity down by 21% in March, and I am sure that a large part of that was through the visualisation, report and sketches.

Ian Clark, Oundle School

The materials have been used in a variety of ways in outreach, training for service providers, posters and in classes with changes in behaviour starting to be noticed straight away and helping Oundle School move forward on the path towards environmental sustainability.

University of Plymouth - The Carbon Footprint

CLIENT

University of Plymouth

PURPOSE

To engage students, academics and staff, show emissions are real and that the University is endeavouring to achieve reductions.

DESCRIPTION

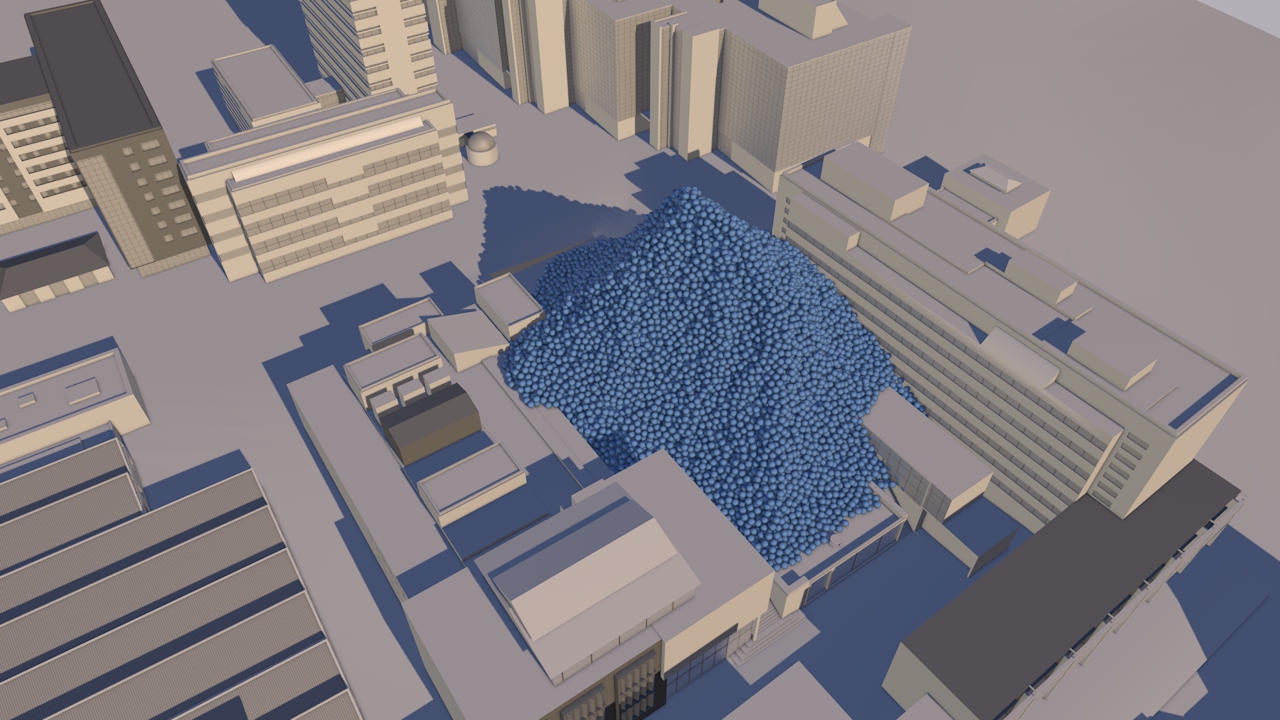
Animation showing the footprint using the campus itself for scale and including a success story where emissions have been reduced.

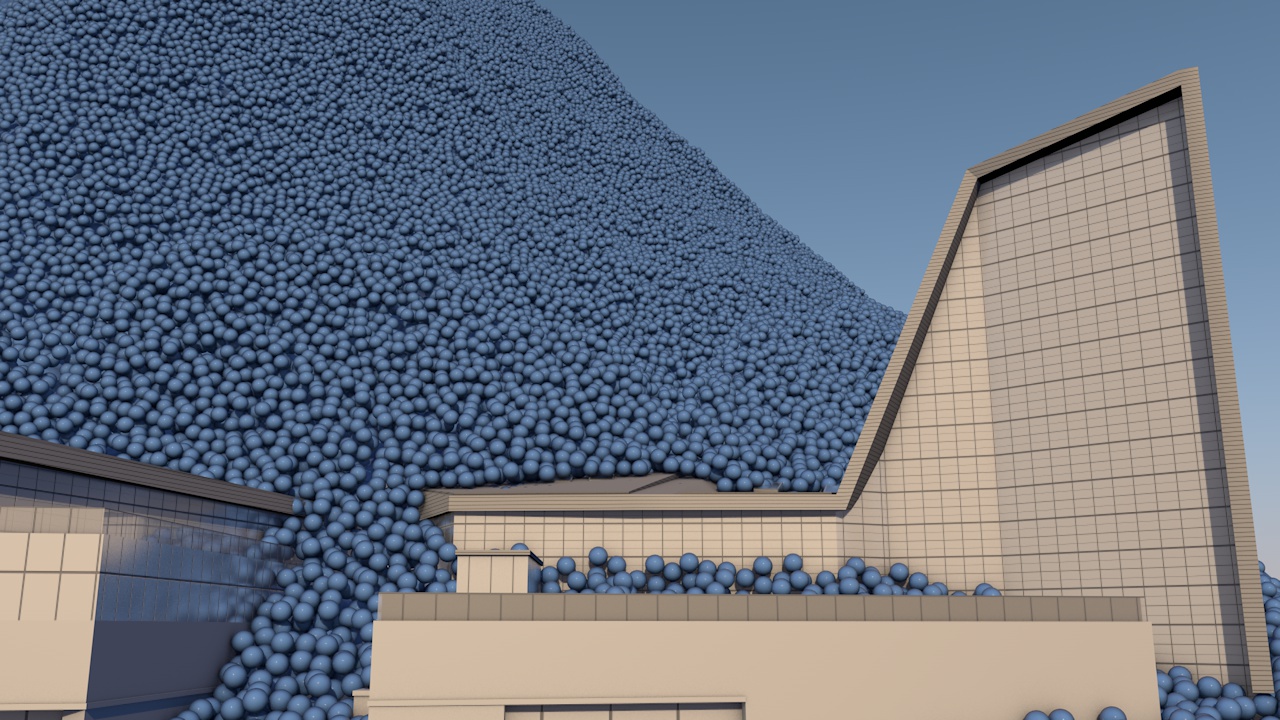
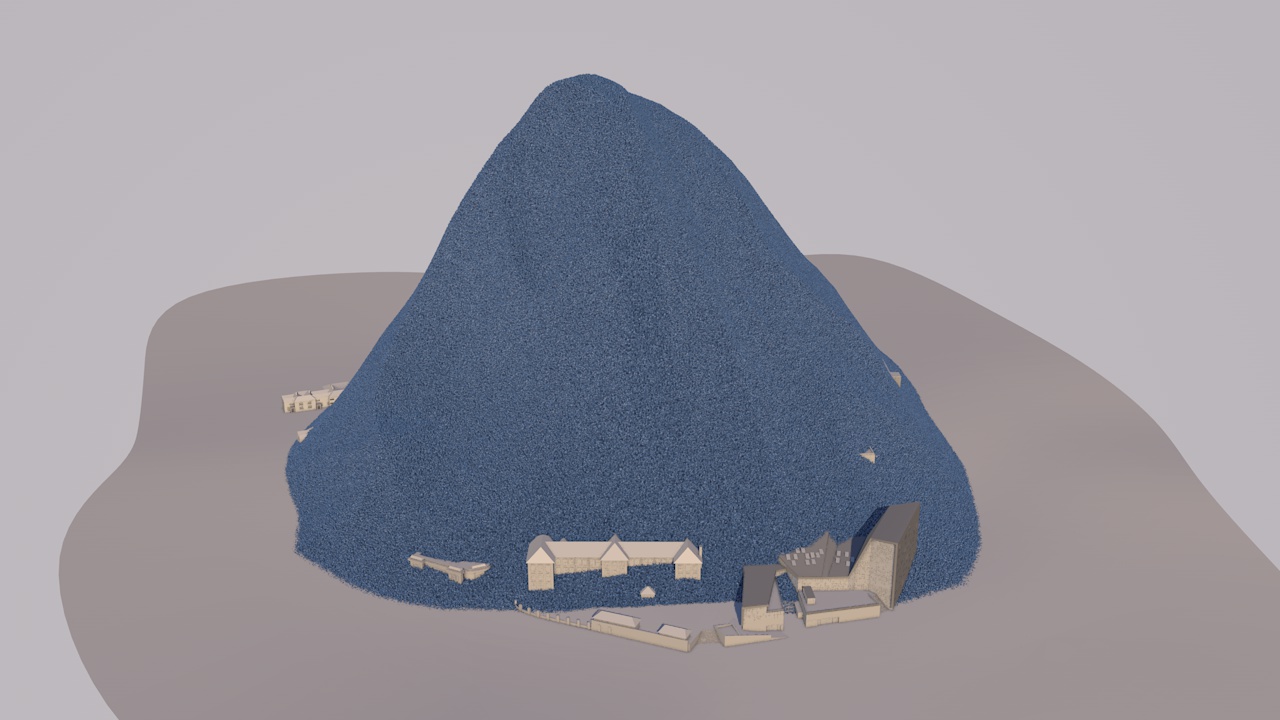
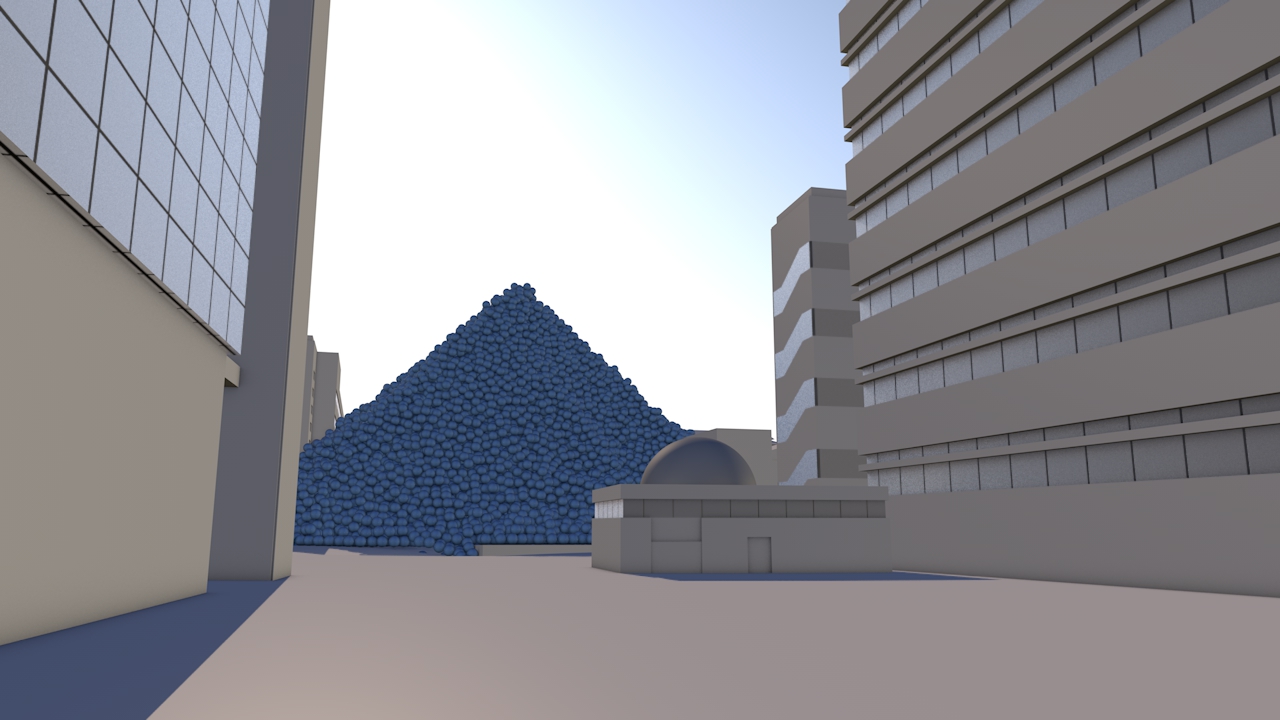
The University of Plymouth adds 11 thousand tonnes of carbon dioxide to the atmosphere every year. But what does that look like?

This animated film illustrates this footprint using the campus itself for scale and shows a ‘success’ story’ where emissions have been reduced.

The purpose of the video was to engage otherwise uninterested students, academics and staff, get them to realise that carbon emissions are real and show that the university is endeavouring to achieve measurable reductions. The intention is then to invite them to explore more detail through web-based energy and carbon dashboard.

The annual carbon reduction savings of 213,890 KgCO2e were achieved at the Babbage building after lighting and IT upgrade, installing voltage optimisation and connection to the Combined Heat & Power (CHP) plant. These savings are expected to equate to the annual emissions of the new Marine Building.


FURTHER INFORMATION

University of Plymouth Carbon Management Plan 2010 - 2015 here.

Sustainability pages for Plymouth University here.


Animating the world's cars

A short animated film from Carbon Visuals is being used to engage managers around the world about the fundamentals of sustainability, how sustainability is relevant to their role and its importance to business success.Created for the University of Cambridge Institute for Sustainability Leadership (CISL), the film shows the current and expected resource use and parking space of all the world’s cars, as well as the CO2 emissions of cars today.

Emissions saving of Coati House at Paignton Zoo

Carbon Visuals has created an image to illustrate the energy saving of the highly insulated Coati House at Paignton Zoo. The sustainable building uses recycled plastic, green oak sleepers, FSC timber and 150mm thick black mountain sheep wool insulation so that heating is not required.

Without this insulation the zoo would have installed a 4kW electric heater. The image shows the actual volume of CO₂ that would have been emitted every day or every hour by such a heater.

Paignton Zoo Environmental Park, is a combined zoo and botanic garden in the South West of England that welcomes over half a million visitors a year.

Sequestered carbon in innovative building panels

ModCell is a novel and innovative building system that brings the benefit of straw bale construction - exceptional levels of insulation - into the mainstream of the construction industry. Carbon Visuals was asked to provide images to show the sequestered carbon dioxide in panels and in a recently completed project - a school science centre in Bath.

Visualising the greenhouse gas emissions for London’s Strategic Health Authority

Carbon Visuals was commissioned by UCLH (University College London Hospital), to create a set of images and a short animated film depicting the carbon footprint of all London's hospitals and NHS Trusts.

The visuals are used in conferences and workshops where facilities and energy personnel, as well as a wide range of other stakeholders, can get a better understanding of actual emissions, emissions reductions and the differences between different hospitals.

Real-time Energy & Carbon Displays for Devon Visitor Centre

Carbon Visuals has created real-time energy and carbon visualisation displays for a new Visitor Centre at Occombe Farm, a working organic farm that includes an award-winning farm shop, a cafe featuring local food and drink, a nature trail, an education centre and cookery workshops.

Supporting carbon literacy at Plymouth University

Carbon Visuals was invited to provide a set of images to illustrate the daily and annual carbon footprint of greenhouse gas emissions from selected buildings on the University of Plymouth campus.

The purpose of the project was to support carbon and energy-reduction activities by staff from the Estates Department. In addition the University is planning research to determine the effectiveness of this kind of communication with students, academics and staff.

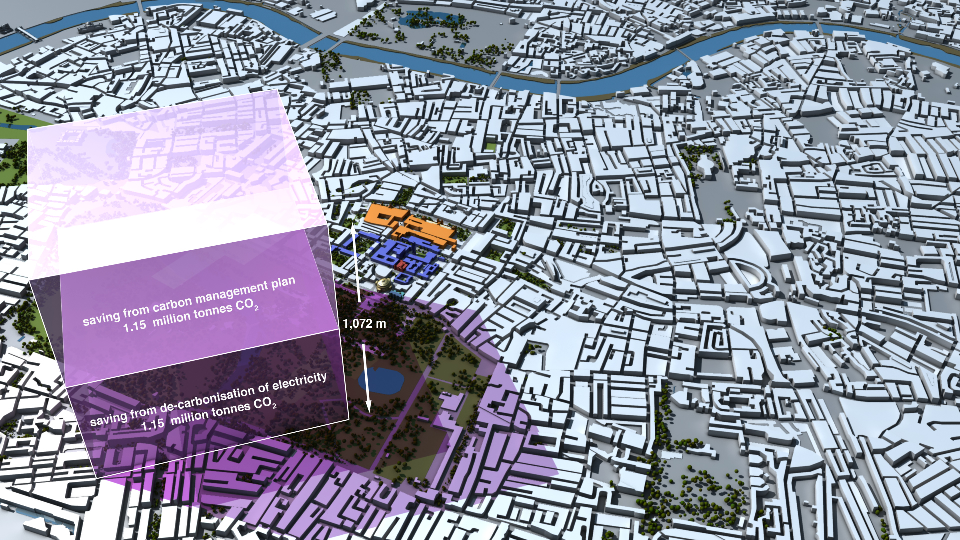
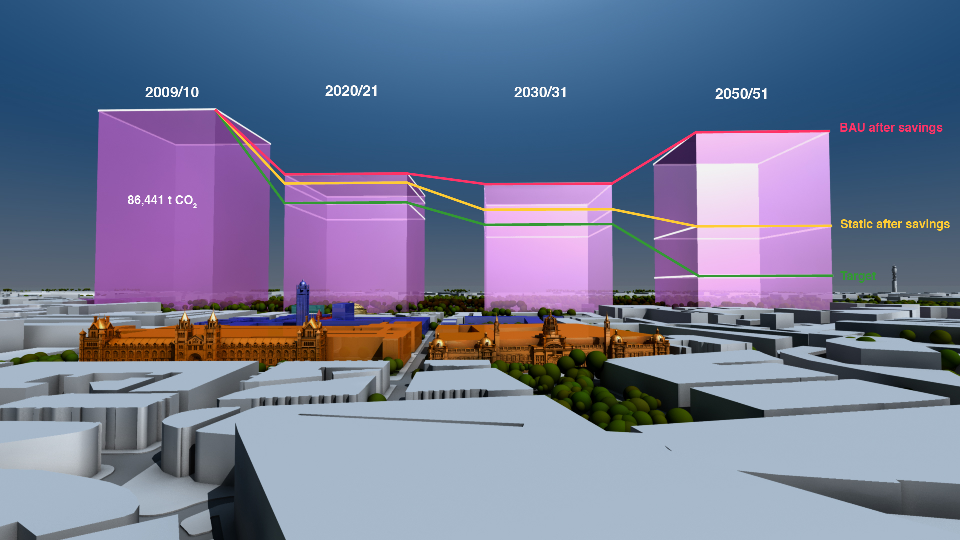
Illustrating carbon reduction potential for South Kensington 1851 Estate

CLIENT

Natural History Museum, Science Museum, V&A, Imperial College and Royal Albert Hall

PURPOSE

To illustrate the carbon reduction potential for the South Kensington 1851 Estate.

DESCRIPTION

Striking image set, to illustrate the Carbon Reduction Masterplan launched by the Minister of State for Energy and Climate Change.

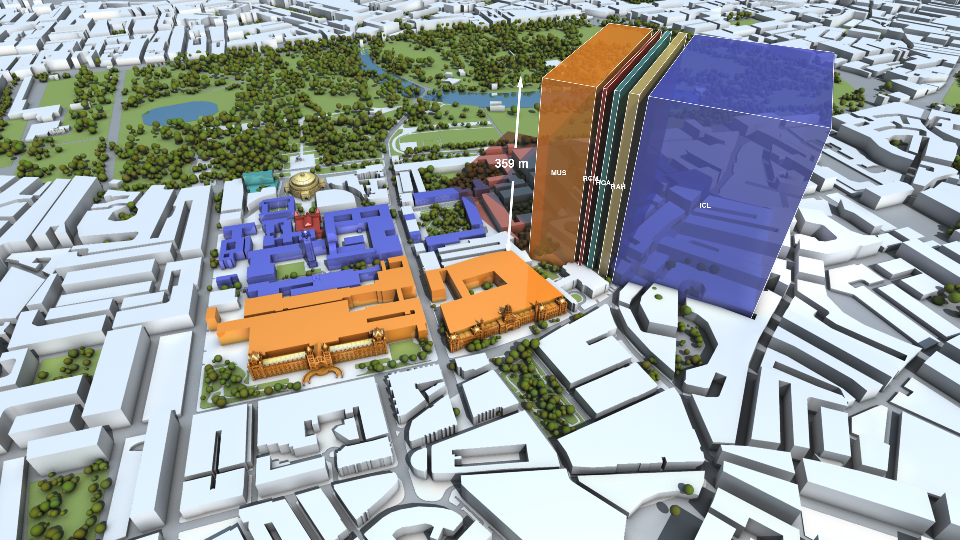
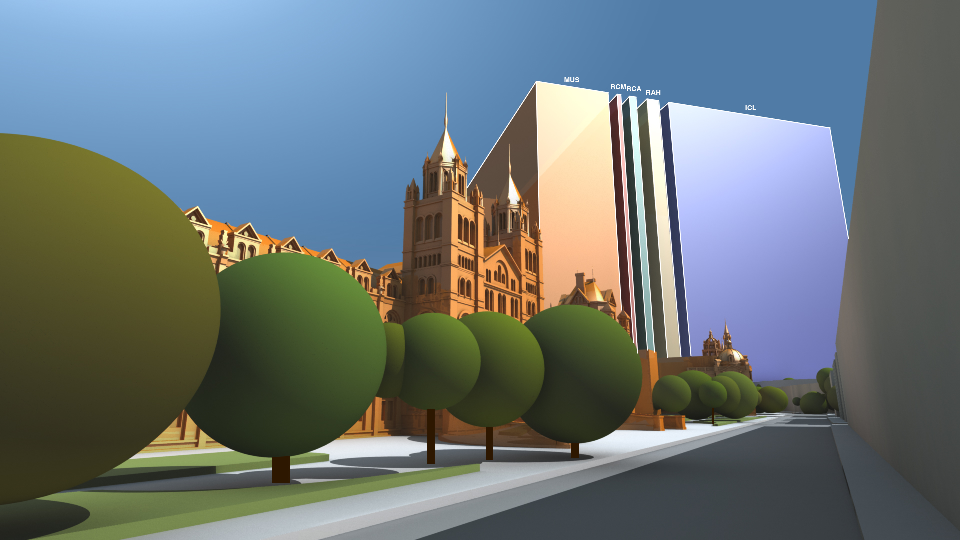
Carbon Visuals has created a set of striking images to illustrate the carbon reduction potential for the South Kensington 1851 Estate. Organisations involved include the Natural History Museum, the Science Museum, the Victoria and Albert Museum, Imperial College, the Royal Albert Hall, the Royal College of Music and the Royal College of Arts.

These prestigious institutions came together in 2005 to embark on an inspirational long-term carbon reduction plan. Phase One involved laying the foundations and creating a realistic strategy. The Masterplan, launched in November 2011, marks the conclusion of that phase and the commencement of its realisation.

Carbon Visuals aided communication amongst the parties and with external stakeholders by creating striking imagese at various stages of the project.

Creating a computer generated model of the Estate enabled a wide range of different images to be created - wide angle, close-up, aerial and ground level.

To see the context in which the images were used feel free to download the PDF of the overview brochure.

Bringing the Royal College of Music carbon management plan to life


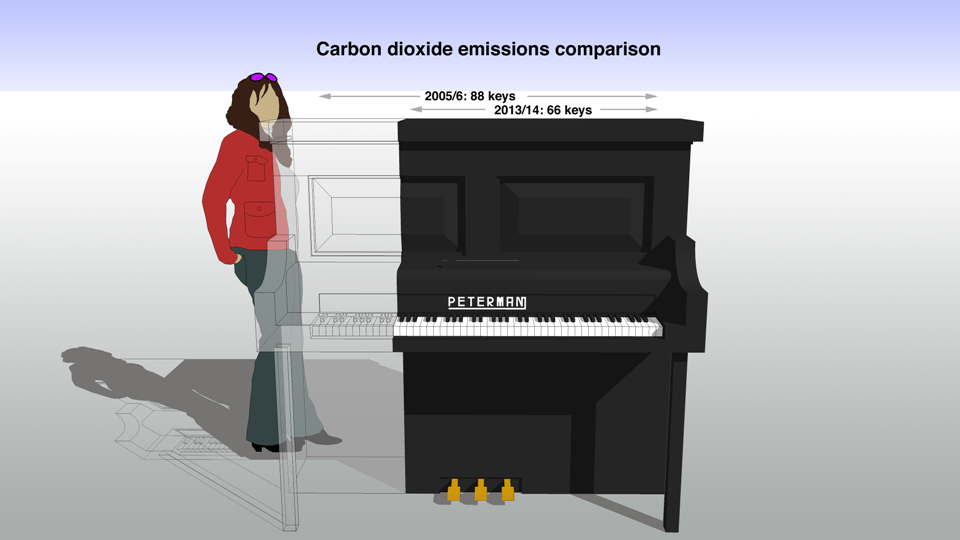
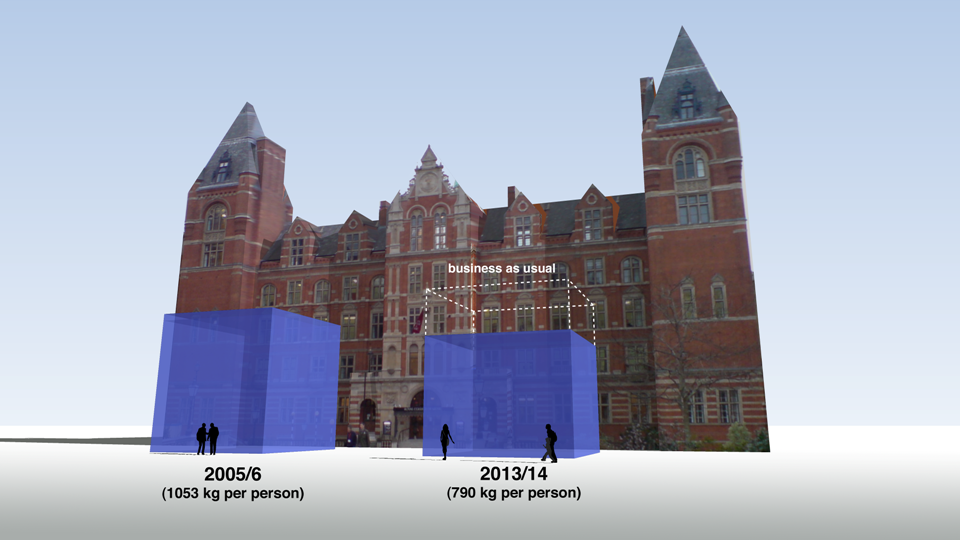
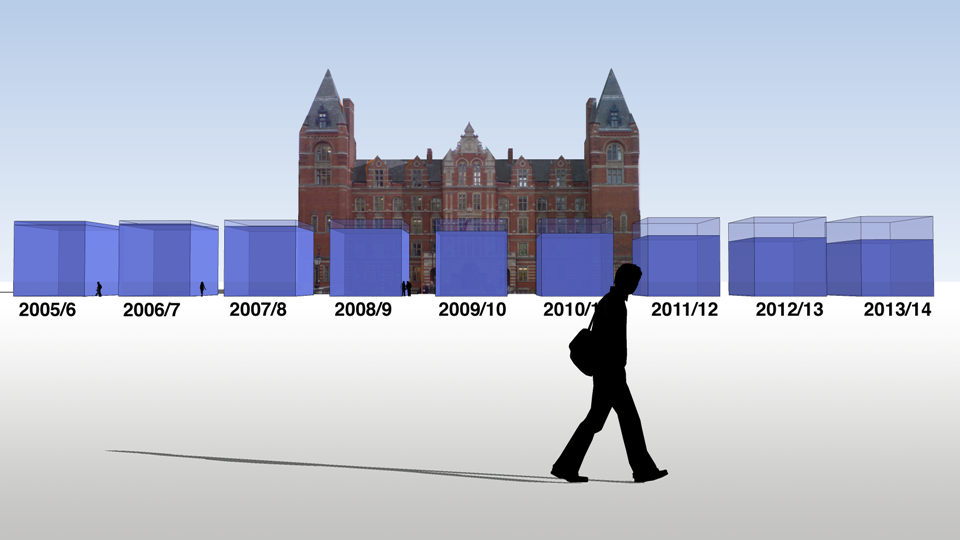
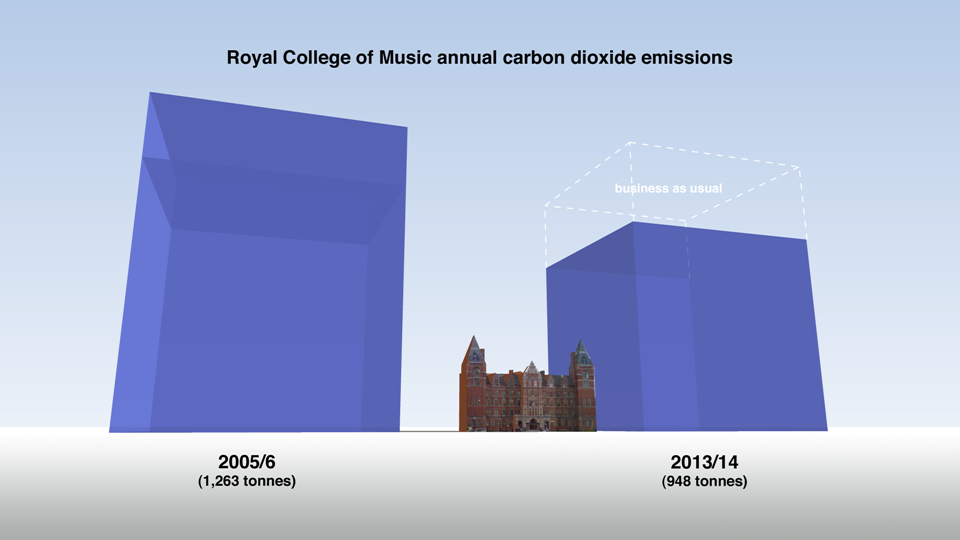
The Royal College of Music worked with the Carbon Trust to develop a Carbon Management Plan, which was published in July 2010. The Plan highlighted a number of actions that could be taken to reduce emissions by 25% by 2013/14.

A key part of the Plan was to get students and staff engaged in the issues, so Carbon Visuals were invited to find innovative ways to communicate the carbon footprint and emissions reduction targets.

It was a very worth while project and has been a well recieved way of getting this difficult message across

Matthew Nicholl, Building Project Manager, Royal College of Music

To turn abstract numbers into quantities that viewers could relate to physically, we used a depiction of the College building. We also proposed a way for musicians in particular to gauge a 25% reduction – it’s like losing nearly two octaves from a piano.

Some of these images are being used for posters, leaflets and presentations to help staff and students have a better understanding of their carbon footprint and create ‘ownership’ of reduction plans and targets.


The Carbon Quilt - a global engagement tool

Instead of trying to communicate the complexities of climate change, we believe that a simple understanding of how we are changing the atmosphere of the planet could transform society’s view of the need for a low-carbon future.

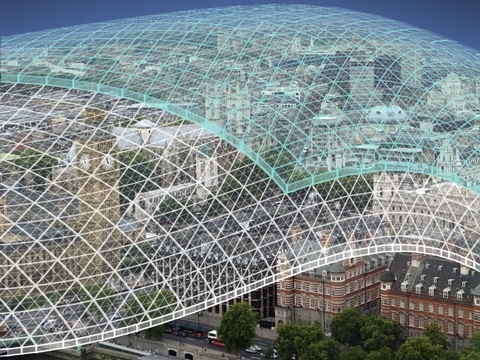
Every day we wrap the planet in a paper-thick layer of carbon dioxide!

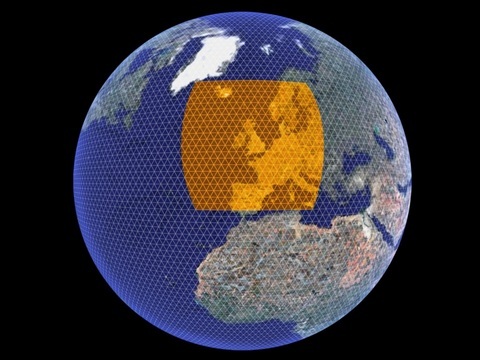
We’ve done the maths and it’s true. The 80 million tonnes of CO2 we release to the atmosphere every day by burning fossil fuels would be 80 microns thick if it were a single, uninterrupted layer at 100% concentration over our heads. Over the course of a year, that amounts to 31mm, or over an inch.

We call this imagined layer the Carbon Quilt – since pre-industrial times its thickness has increased from 2.3 metres to 3.2 metres.

In 2010, with support from The Tedworth Charitable Trust, we 'soft-launched' our Carbon Quilt web-tool that enables people to ‘see’ any carbon footprint – from a short car journey to the footprint of a country or continent. Any carbon footprint can be seen in proportion to any other, and in proportion to the global whole. It can also be positioned in a location that has meaning and provides a sense of scale for the person viewing it.

Carbon Visuals has ambitious plans to develop this technical prototype tool on Google Earth to bring the abstract concept of 'carbon footprints' to life for over a billion people worldwide.

We are now actively seeking funding and/or sponsors to help us to develop this project. Please contact us if you have funding ideas, contacts or expertise that could help advance this project.

BITC Mayday Network businesses' carbon footprint (and reduction)

BITC Mayday Network businesses' carbon footprint (and reduction)

To the left is a picture for the BITC (Business in the Community) Mayday Annual Report 2010.

Each year humans release enough carbon dioxide to cover the entire planet in a layer 37 mm thick. The proportion of this 'quilt' that reporting Mayday Network businesses are responsible for is the green 'patch'.

Total reported emissions in 2010 (green patch) is 5.6 million tonnes of CO2(e). Emission reduction in previous 12 months is shown as the dotted area.

It represents a saving of 400 thousand tonnes of CO2(e).