ALL POSTS
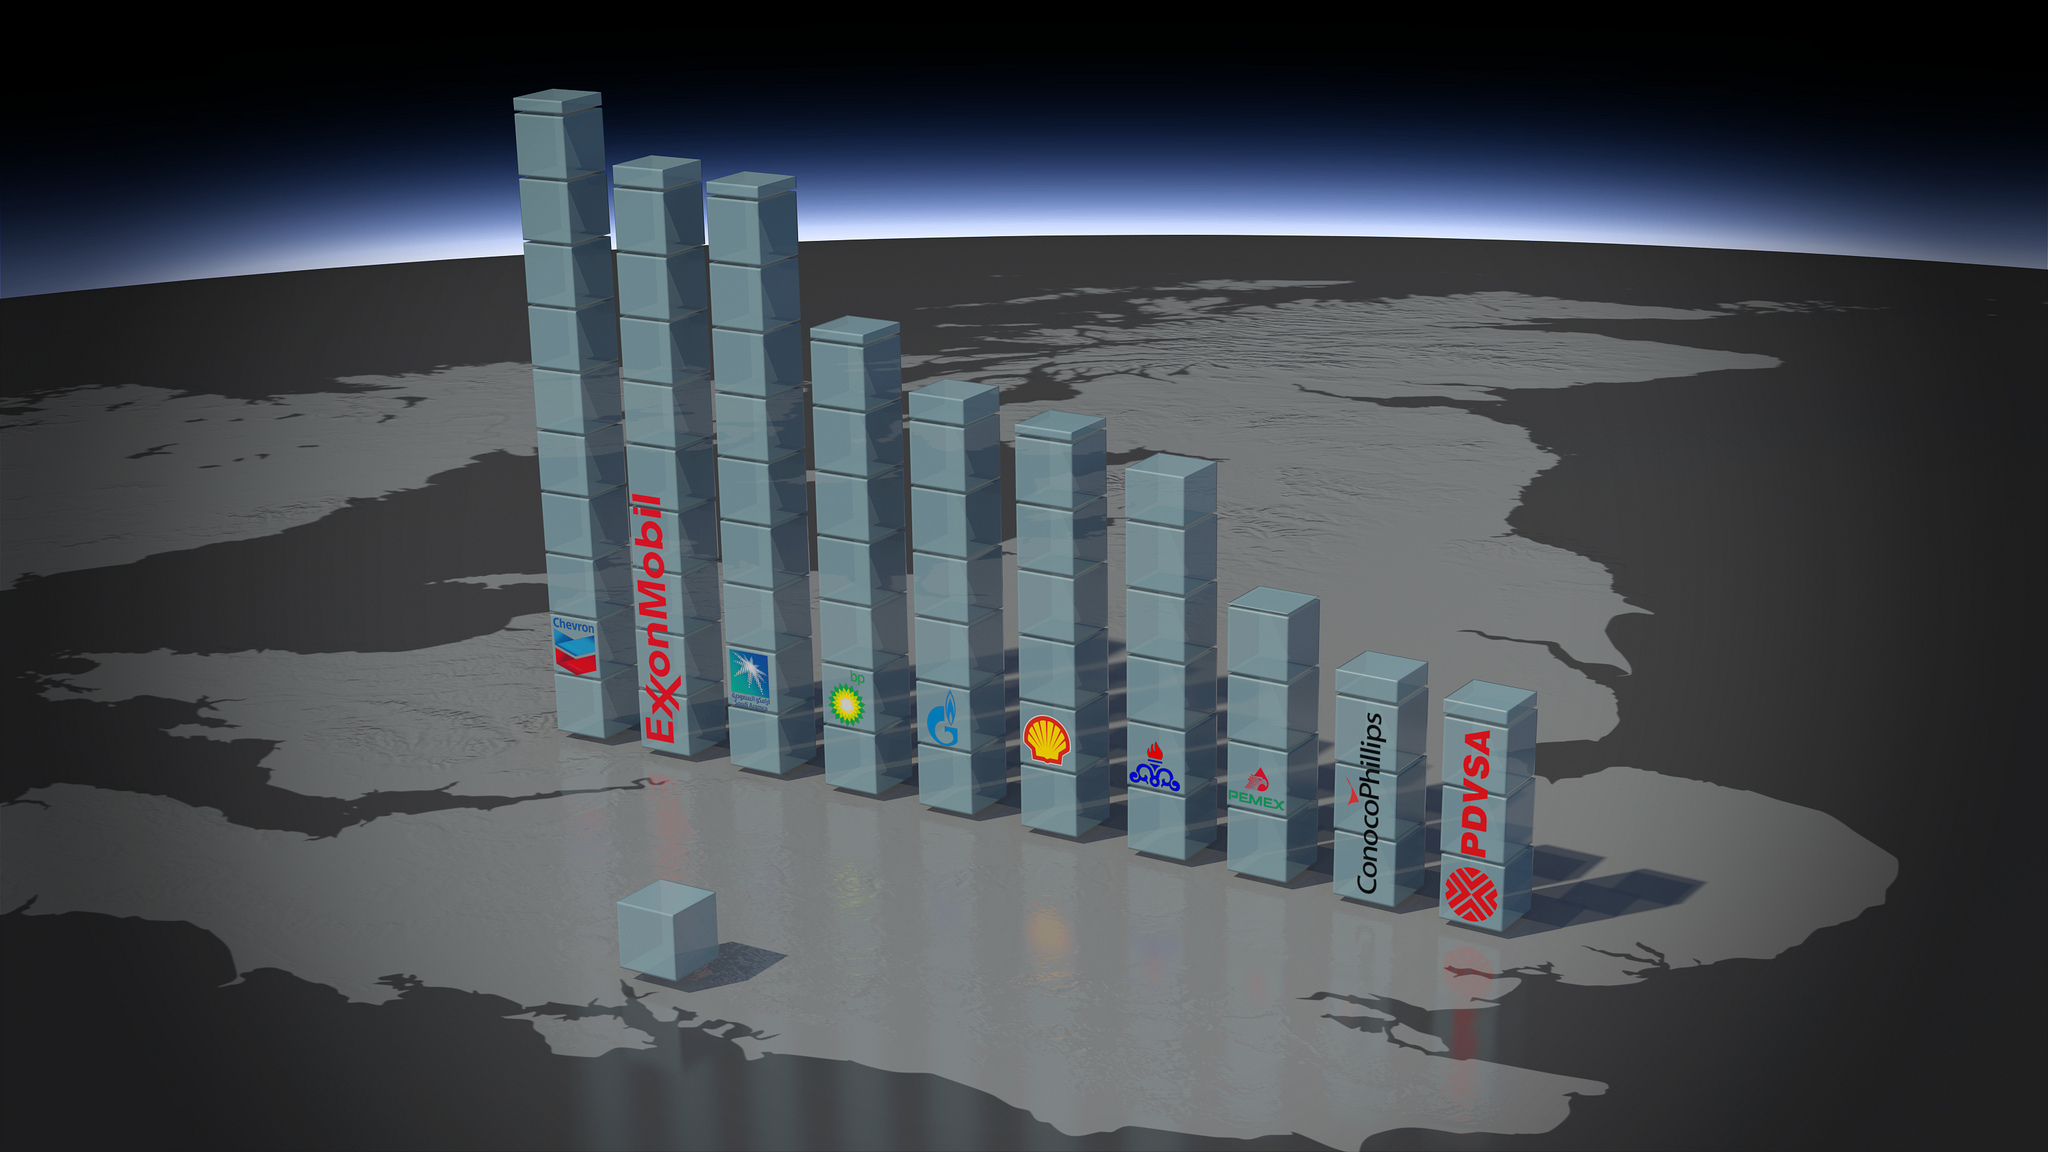
How much carbon dioxide is in a small room courtesy of major fossil fuel companies? This was our question two years ago when we created images for the launch of the groundbreaking Carbon Majors Report.
Energy use in buildings accounts for around 40% of global carbon emissions. Yet normally only buildings and energy managers - ‘engaged’ people are aware or concerned about this energy use. But ‘non-engaged’ building users can help energy reduction by changing their own behaviours if they become engaged in the challenge.
A highlight of 2015 for us was creating the Ozone Song for UNEP where we imagined a festive party of phytoplankton celebrating the success of the Montreal Protocol. We thought these ocean dwellers deserved another party as part of our Christmas message.
The outcome of COP21 extends well beyond national governments and those with a seat at the table at the events themselves. This is about people around the world ‘getting it’ including staff in companies, the data crunchers who analyse the impact of changing CO2 levels and the person on the street feeling informed enough to make the difference through their domestic choices.
If you want to get an issue noticed be bold! Staff at PwC UK have come in to work to see that a giant 10 metre diameter CO2 ‘bubble’ has appeared in the atrium of their London head office.
Our Communications Manager Anna Lodge spoke to Janet Salem, Programme Officer, Sustainable Consumption and Production with United Nations Environment Programme (UNEP) in the Regional Office for Asia and the Pacific. As our main contact within UNEP, Janet has had first-hand experience of collaborating with our creative team. So we thought we would ask Janet about this experience…
Water supports life on our planet. We depend on it. We also make increasing demands on water resources to produce food, crops, energy and other commodities. It is also a scarce resource is many parts of the world where people suffer from droughts or lack of accessible fresh water.
Looking at the Earth can be an empowering experience: it can alter our sense of relationship with it and our role in protecting it. Earth Day is a celebration of the Earth but also of historic and continuing efforts to look after it. So this is a good moment to reflect on the importance of really engaging with the Earth
Earth Hour launched in Sydney in 2007 with backing from the city’s mayor. Inspired by this, San Francisco held "Lights Out" a few moths later. By 2008 there was participation from all continents with many landmark buildings around the world turning off non-essential lighting including the Sydney Opera House and the Empire State Building and participation has continued to increase year on year. In 2009, The United Nations observed Earth Hour at its Headquarters in New York and at other UN facilities around the world including the UN Environment Programme (UNEP) offices in Nairobi, Kenya.
How do you sell low or zero carbon products and services? As more and more companies are putting serious effort into developing products and services for the low-carbon future they face a communications challenge with consumers or B2B customers. How do you get across the benefits of low-carbon in a way that works?
Now there is a solution... an augmented reality app that reveals actual volumes of CO2 through a smart-phone or tablet screen
Communications can serve many purposes - such as providing directions, marketing a product or promoting a brand. It is said that every picture is worth a thousand words and they certainly can be powerful emotionally as well as imparting information.
In the USA at the end of January, the Senate approved construction of the Keystone XL pipeline to transport oil from the Canadian tar sands to the Gulf coast. While the House of Representatives has already approved a version of the bill, President Obama has said he will veto it. Now the Environmental Protection Agency has informed to the State Department that the pipeline would cause a significant increase in carbon emissions.
Trees store carbon. Our jumbo-sized Christmas Tree is based on a single Sitka Spruce, grown commercially in the UK. Over a typical 40-year life the tree will capture and store 742 kg of carbon dioxide. So we thought it would be fun to show that happening - admittedly with a touch of Christmas magic!
There is a clear aim for leaders this December at Lima. But the reality is that this is a shared challenge. Every person, company, organisation on this planet needs to see this challenge and relate world emissions, to temperature rises and their own potential to contribute to the solution
We are looking for a creative and numerate graphic designer with a flair for 2d / 3d data visualisation to join us in our Stokes Croft, Bristol office. The position would suit a design graduate or perhaps freelance / junior designer with some commercial experience and an interest in the environment.
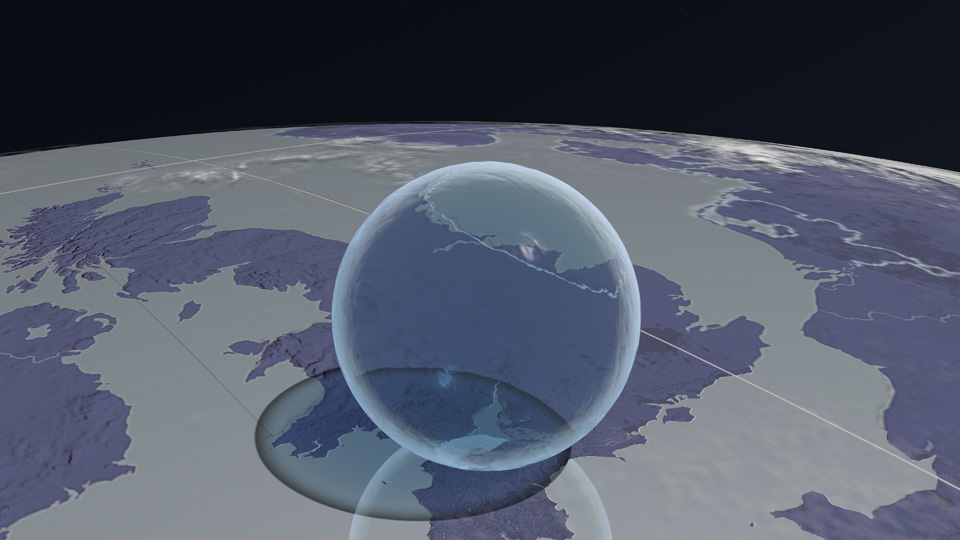
Shell and their creative agency JWT asked Carbon Visuals to provide dimensional reference sketches and methodology checking for the company’s visual campaign on Carbon Capture & Storage (CCS).
The campaign, run by Shell with images by JWT, highlights the amount of CO2 - one million tonnes per year - that could be captured from the Peterhead Power Station and transported by pipeline offshore for long-term storage deep under the North Sea.
The title of this blog post was changed at the request of JWT in March 2015. Carbon Visuals also complied with a request to remove copies of the posters and a photograph of the Forth Bridge poster in situ in a London Underground Station
All the available freshwater is an animation I have wanted to make for years. We were delighted when South West Water wanted to make it too. This blog post explains some of the history.
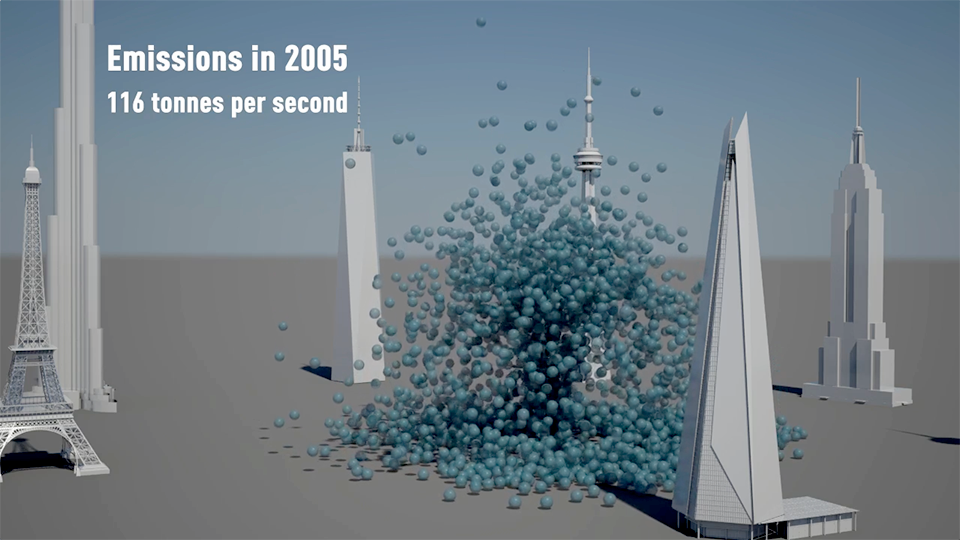
The opportunity to create a film to show the world’s CO2 emissions in real-time has been a long-held dream. We wondered if this was the moment when we were approached by WBCSD to make a film to show the necessity of Carbon Capture & Storage (CCS).
Our film would have to clearly articulate the role of CCS in keeping global warming below 2° C threshold, as well as showing that renewables, though growing fast, are not growing as fast as global energy demand. We would also need an introduction to the scale of the problem in terms of global fossil fuel usage and of course carbon emissions!
You may have guessed we’re all rather enthusiastic about sustainable alternatives to carbon-hungry living. So to visualise the Story of Trees was a dream ticket. What followed brought Wood for Good and Carbon Visuals teams together for a highly creative and surprisingly intricate story.
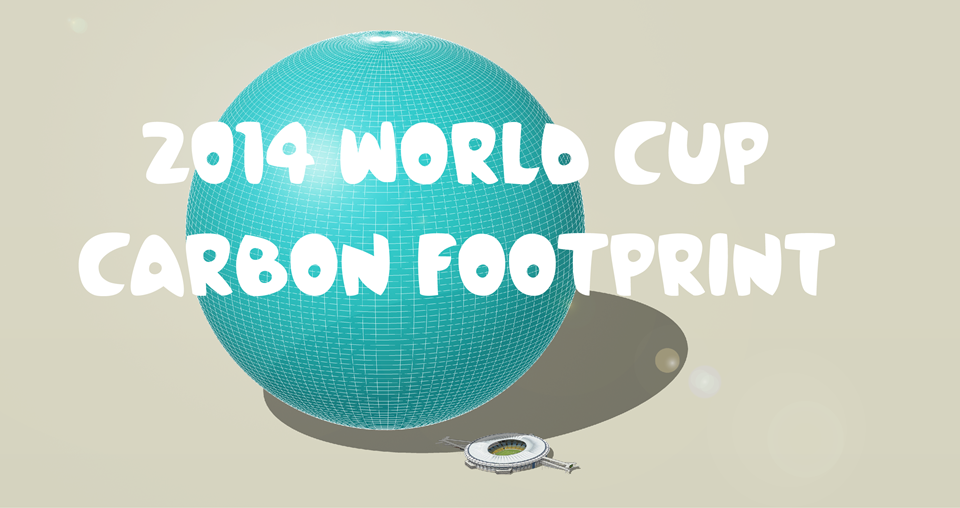
Some offices organise a sweepstake for the World Cup. However, perhaps predictably (unlike the semi-final on Tuesday) we got interested in the associated emissions of this occasion. We started to think – what would the carbon story of a global event like this look like? Luckily we could turn to FIFA's own comprehensive calculations document to find out.
When the President of the USA spoke directly about the EPA proposed carbon reduction target of 30% for USA power stations we knew this was the start of an important consultation process.
Almost simultaneously that the EPA was announcing its Carbon Reduction Plan, Aaron Selverston of Green Biz contacted us about a piece he was writing highlighting the evolving and vital role of carbon visualisation in supporting environmental priorities at this time.
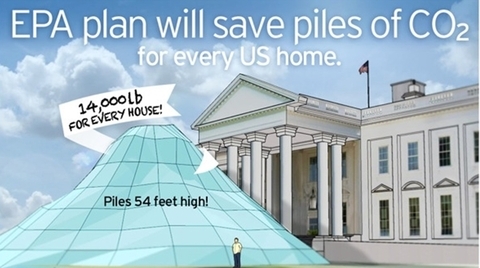
Under President Obama’s Climate Action Plan, the Environmental Protection Agency (EPA) proposes a 30% reduction in carbon pollution from power plants by 2030. But the numbers are big. And we wanted to show the actual volume of CO2 saved in a way that everyone can understand.
We have teamed up with technical consultants ERG to show, at a White House event, how environmental data can inspire and influence change.
Five years on, our far-fetched idea of forming a business to visualise carbon emissions and other invisible stuff is developing at a pace. What gives me real satisfaction is that the range of clients is so extensive – campaigners, universities and corporations. Each has a story to tell – and the narratives speak of both challenge and opportunity.
Carbon Visuals will be displaying an exhibition of images and film at a fringe event of Clerkenwell Design Week hosted by energy and low-carbon services consultancy XCO2 Energy. Included will be images showing energy efficiency and actual volumes of CO2 of London’s public buildings.
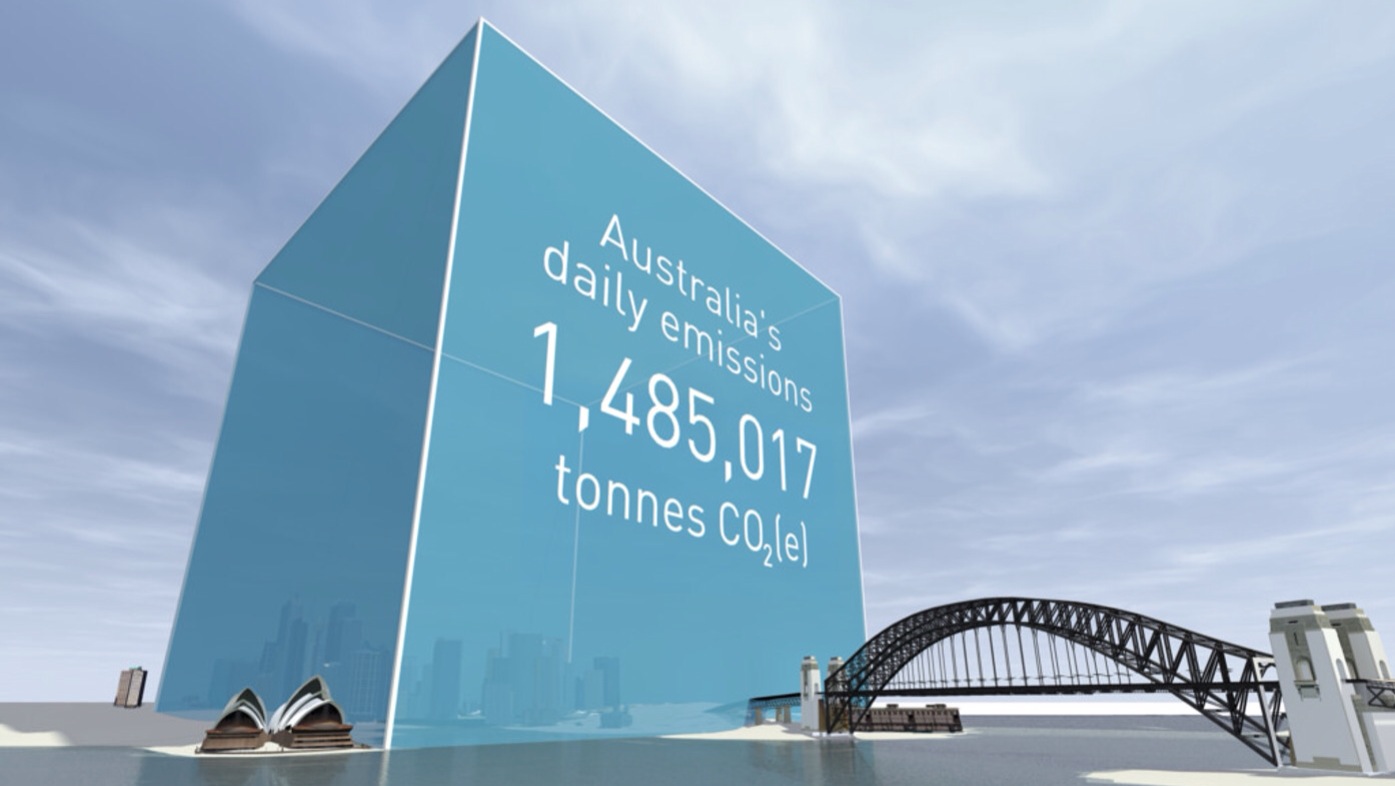
Carbon Visuals has created some simple images to show the potential for engaging Australians in their country’s ‘carbon story’. The images support an article for The Conversation by David Holmes, journalist and lecturer in Communications and Media - Visualising Australia’s carbon emissions.
Ted Flanigan of EcoMotion contacted us at Carbon Visuals last year having seen one of our early images of a London Bus next to one metric tonne of Carbon Dioxide. At that point EcoMotion had recently designed and produced a giant inflatable representation of a ton of carbon dioxide. Over 31 feet in diameter, THE Ton is a gigantic air-filled ball. A dramatic sight, specifically designed to stimulate people into reducing their emissions.
Our core design team in Bristol, headed up by Creative Director Adam Nieman, has been greatly enhanced by the addition of two new faces - Daniel Ulf-Hansen and Dave Forman who complement our existing contract programmers, 3D graphics and animation guys (yes, they are all guys at the moment).


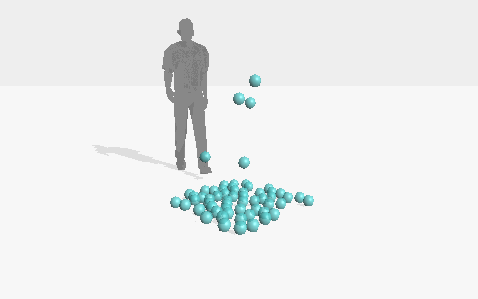



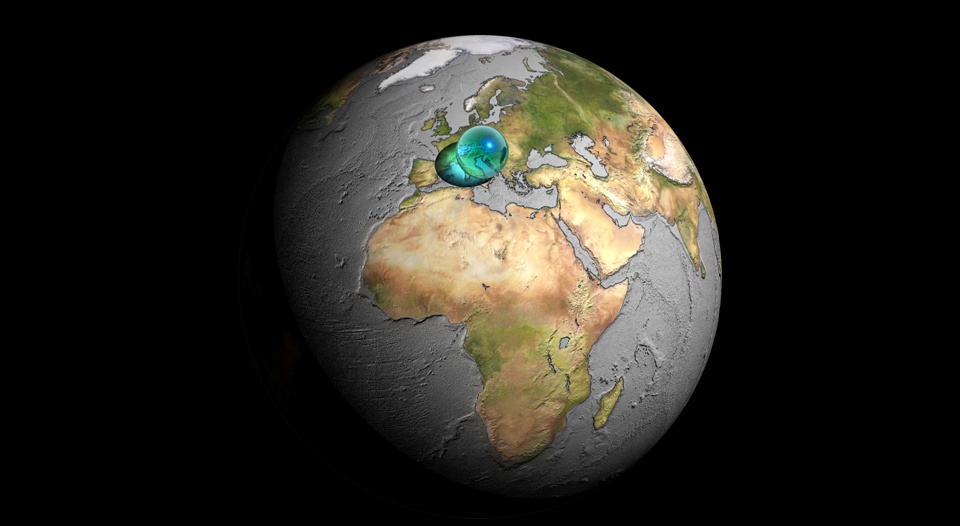


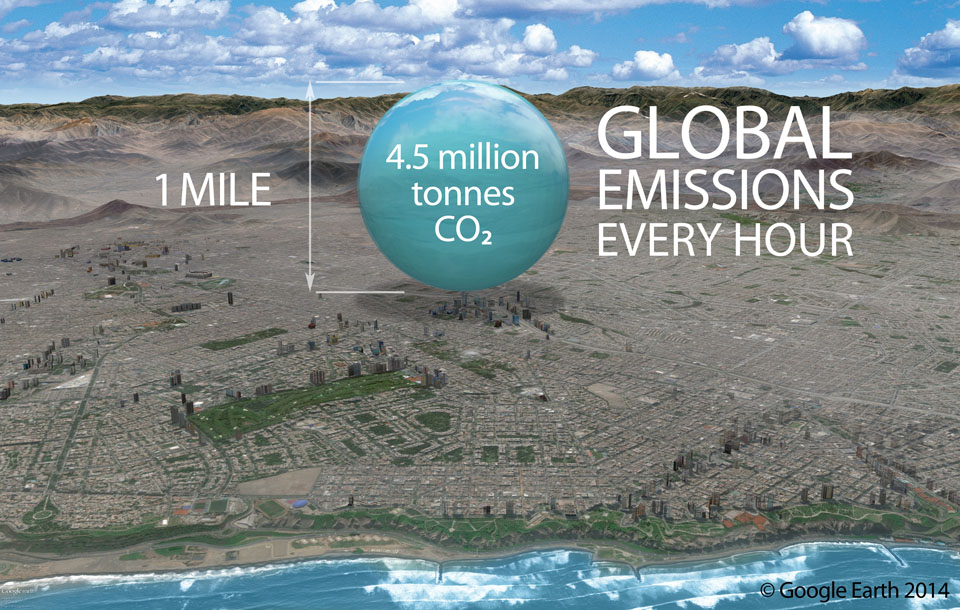







At Carbon Visuals we have been thinking about air pollution: why it needs visualisation and how best to visualise it. These are some initial sketches.