transport

How do you sell low carbon?

CLIENT

Self-initiated

PURPOSE

To put visuals of real-time emissions into users hands.

DESCRIPTION

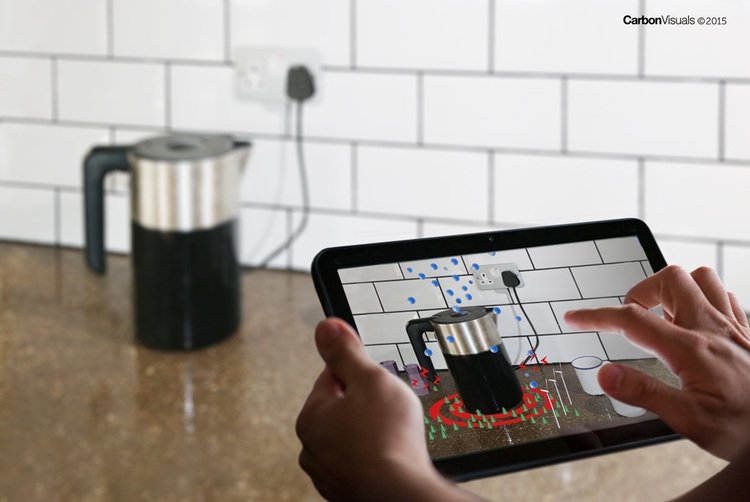
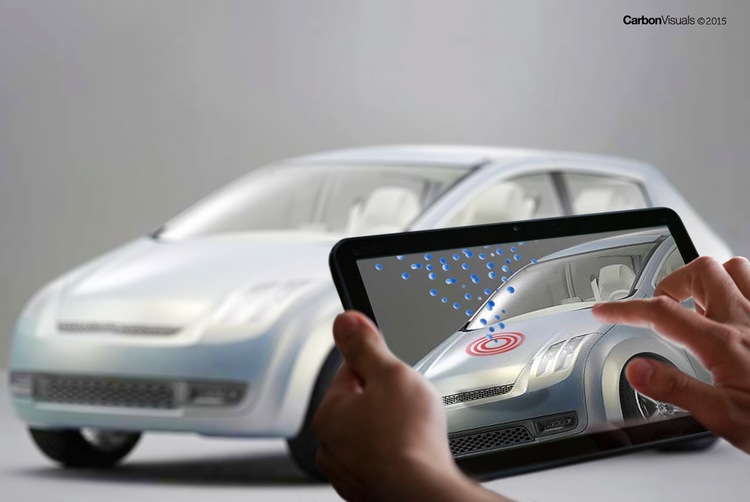
Development of an augmented reality app that reveals actual volumes of CO2 through a smart-phone or tablet screen.

How do you sell low or zero carbon products and services? As more and more companies are putting serious effort into developing products and services for the low-carbon future they face a communications challenge with consumers or B2B customers. How do you get across the benefits of low-carbon in a way that works?

Now there is a solution... an augmented reality app that reveals actual volumes of CO2 through a smart-phone or tablet screen.

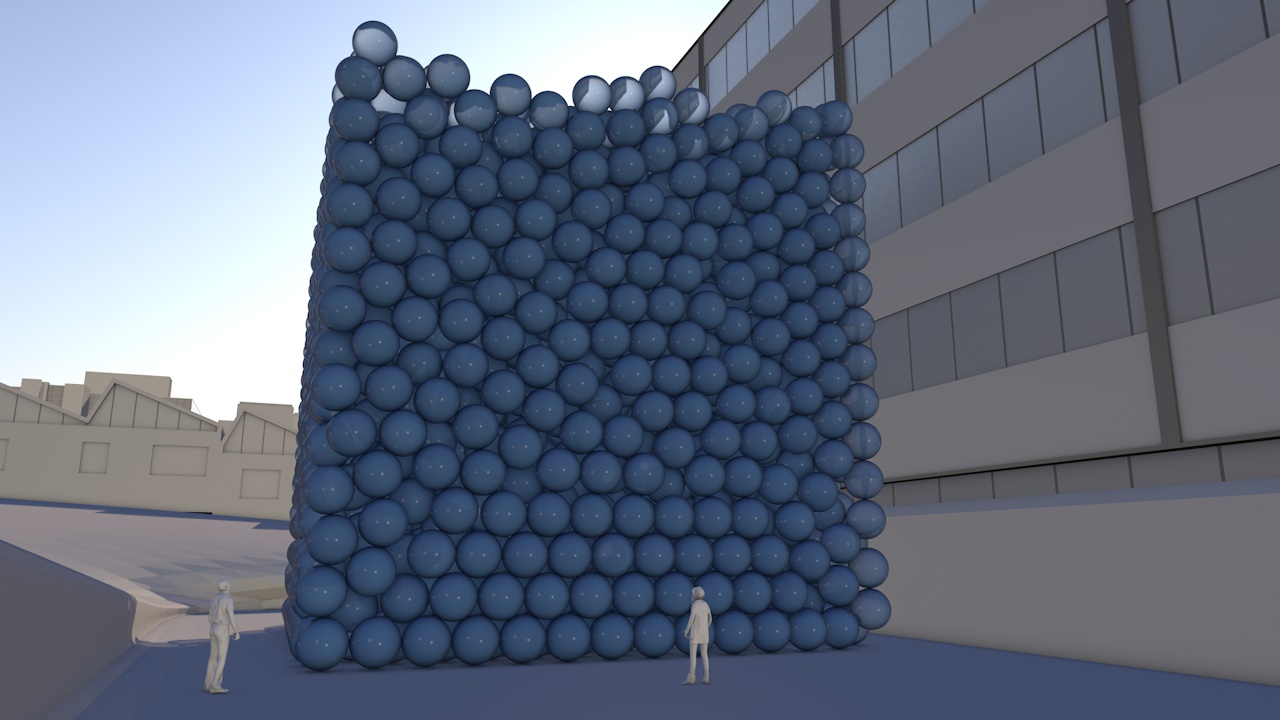
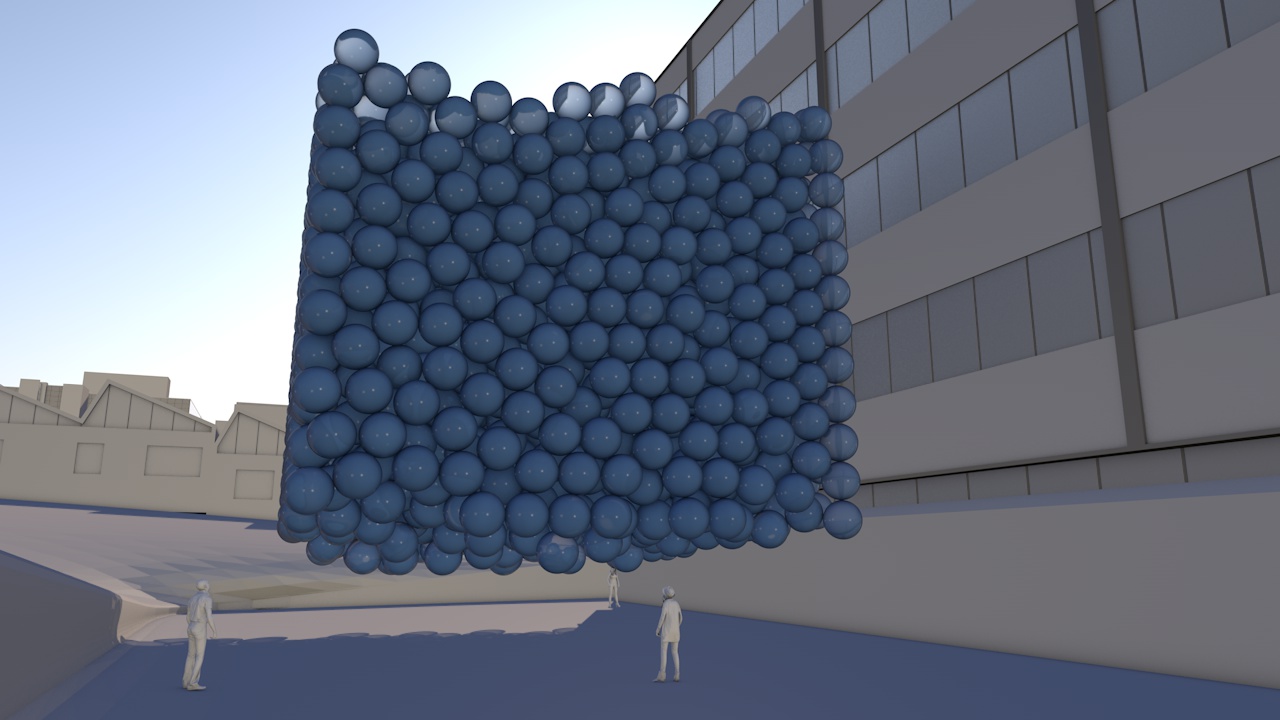
We are pleased to announce that we are developing an app which allows viewers to ‘see’ the volumetrically accurate carbon emissions associated with household appliances, furnishings, vehicles, buildings, power stations... as real-time flows or bubble piles. Furthermore, using the app, sales teams and their potential customers will be able to compare services and products clearly showing the difference in emissions in the purchase of low-carbon options.

The ability to reach out to consumers through simple apps is very compelling.

Antony Turner, CEO Carbon Visuals

The ability to reach out to consumers through simple apps is very compelling. In addition we can design a complete sales solution around the app that engages and easily invites B2B or B2C customers to purchase low-carbon options.

Key features of the app include:

COMPARISON - shows the carbon footprint of products or services in comparison to your competitors

ACTUAL VOLUMES - demonstrates the actual volumes of CO2 as real-time streams or bubble piles / blocks

SHOW COSTS – combines with other important metrics e.g. costs

EASY-TO-USE - we work with your marketing team to create relevant and easy user interface within your sales campaigns

Versions are envisaged that highlight and compare low-carbon benefits of energy, vehicles, furnishings, building products etc.

For instance we can design a system for the green energy market where consumers are invited to buy energy that has a substantially lower carbon footprint than a fossil-fuel based energy mix. We envisage combining the technology with an elegant sales promotion campaign developed with the energy company's own marketing team.

Another example envisaged would be a version for use in car dealerships where new plug-in or eco-efficient cars are for sale. A simple set of questions about a customer’s existing car and journeys can allow the sales rep to immediately show the emissions associated with the 'old' car v the new model alongside financial savings.

Educational opportunities are limitless provided the data is available, and games-based versions could enable understanding of our 'high-carbon' world in a fun and sharable way.

To find out more about how this app could help your sales campaign, or to discuss other potential applications, please contact:

Antony Turner, CEO antony.turner@carbonvisuals.com

University of Plymouth - The Carbon Footprint

CLIENT

University of Plymouth

PURPOSE

To engage students, academics and staff, show emissions are real and that the University is endeavouring to achieve reductions.

DESCRIPTION

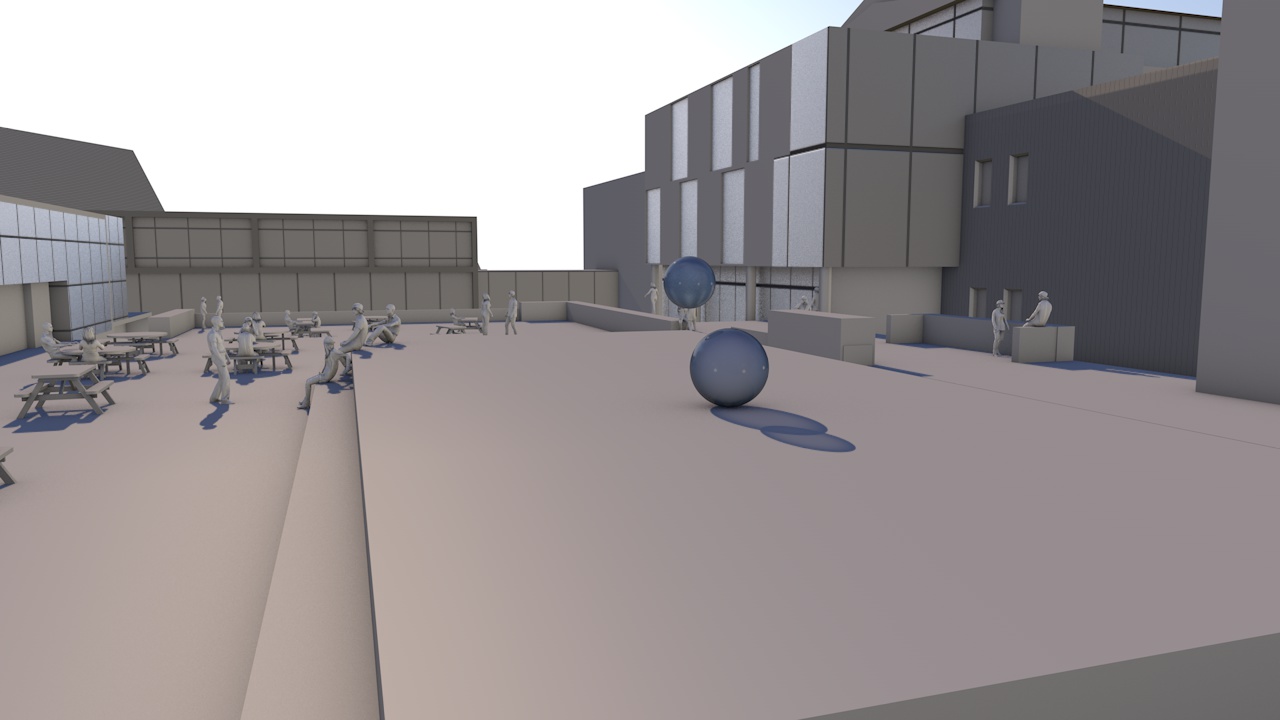
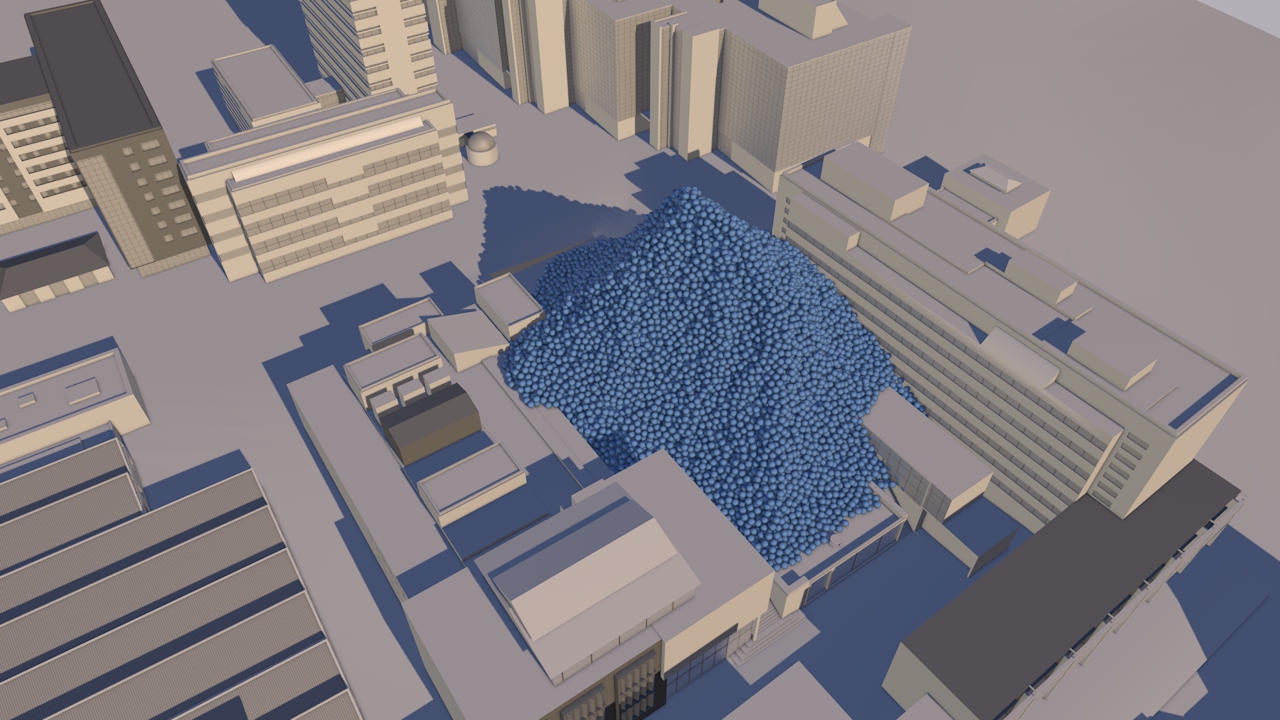
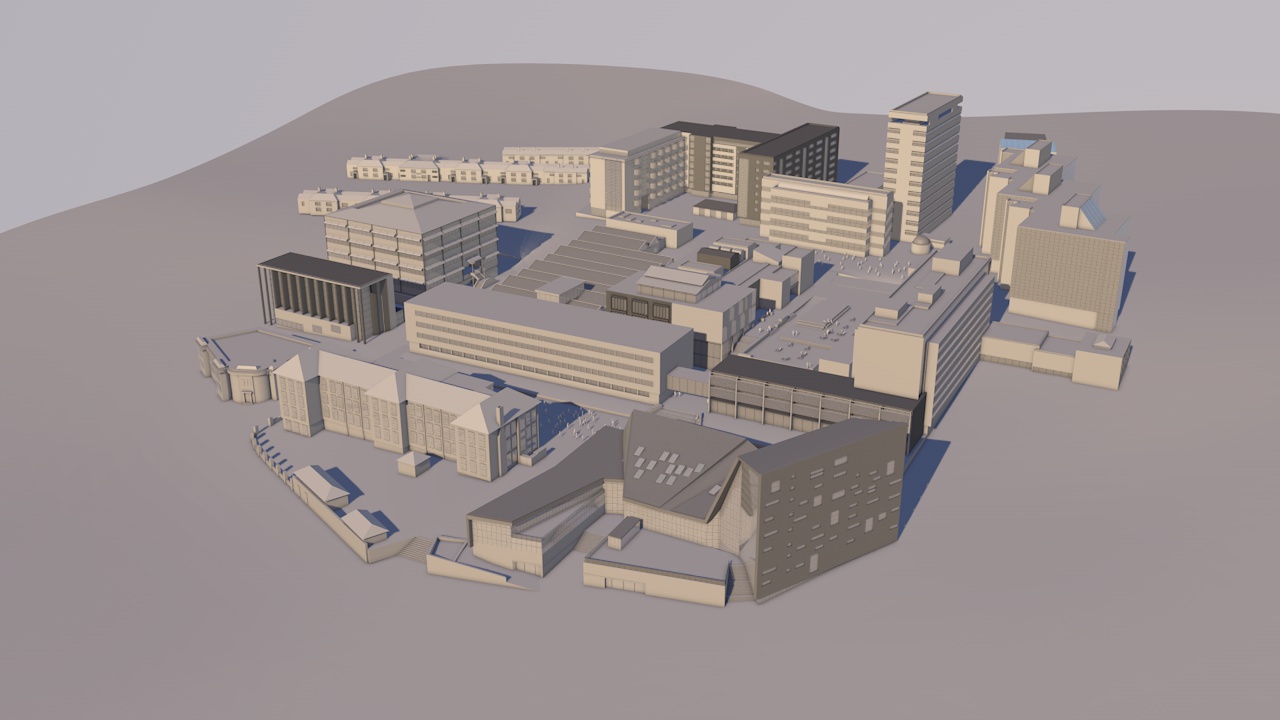
Animation showing the footprint using the campus itself for scale and including a success story where emissions have been reduced.

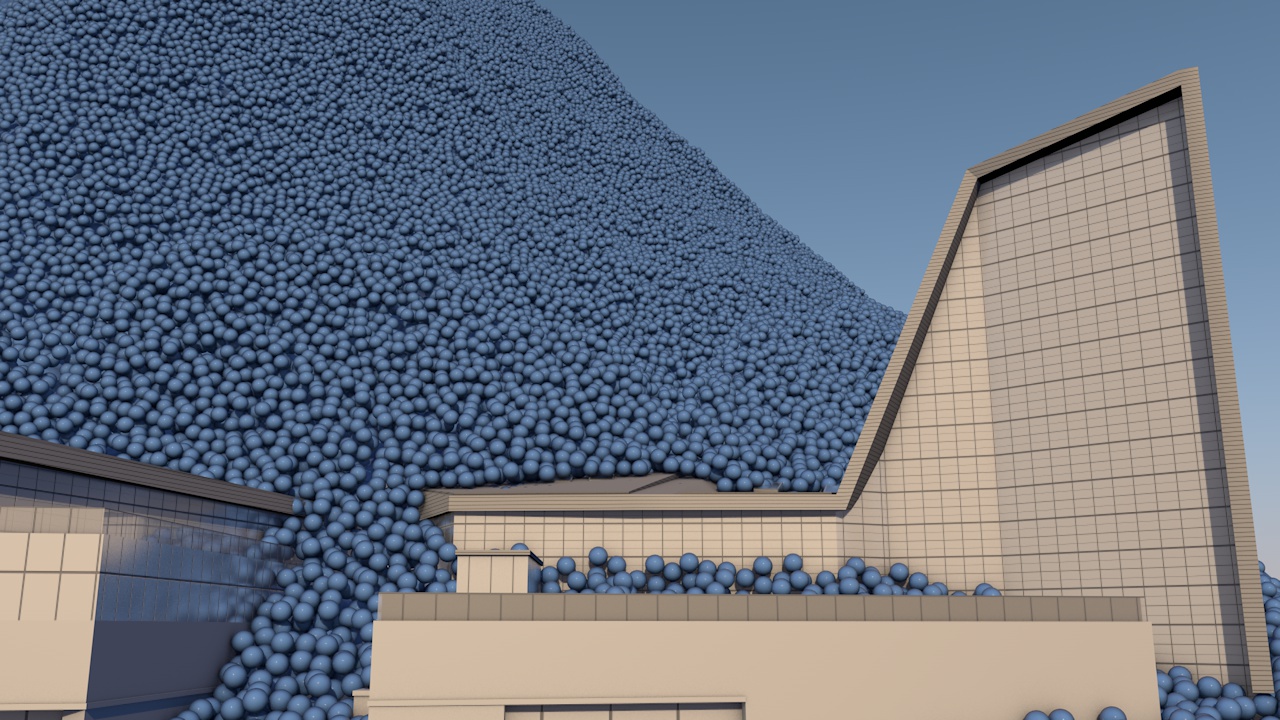
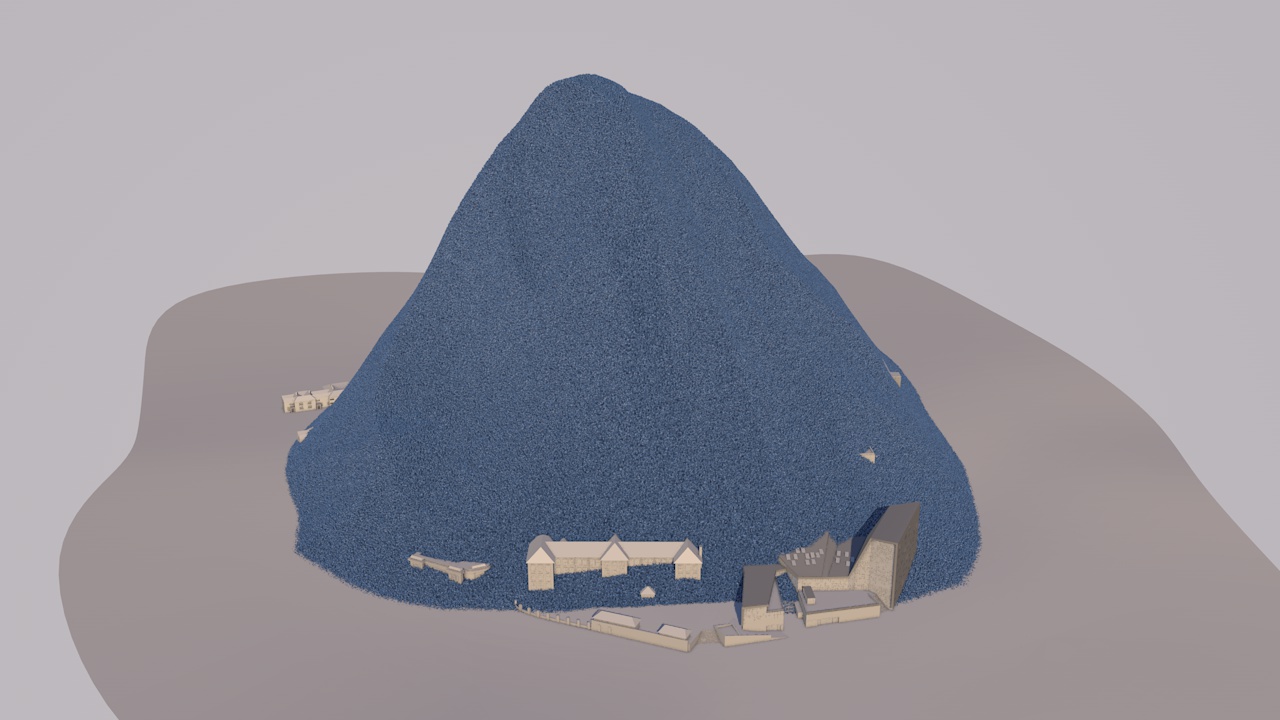
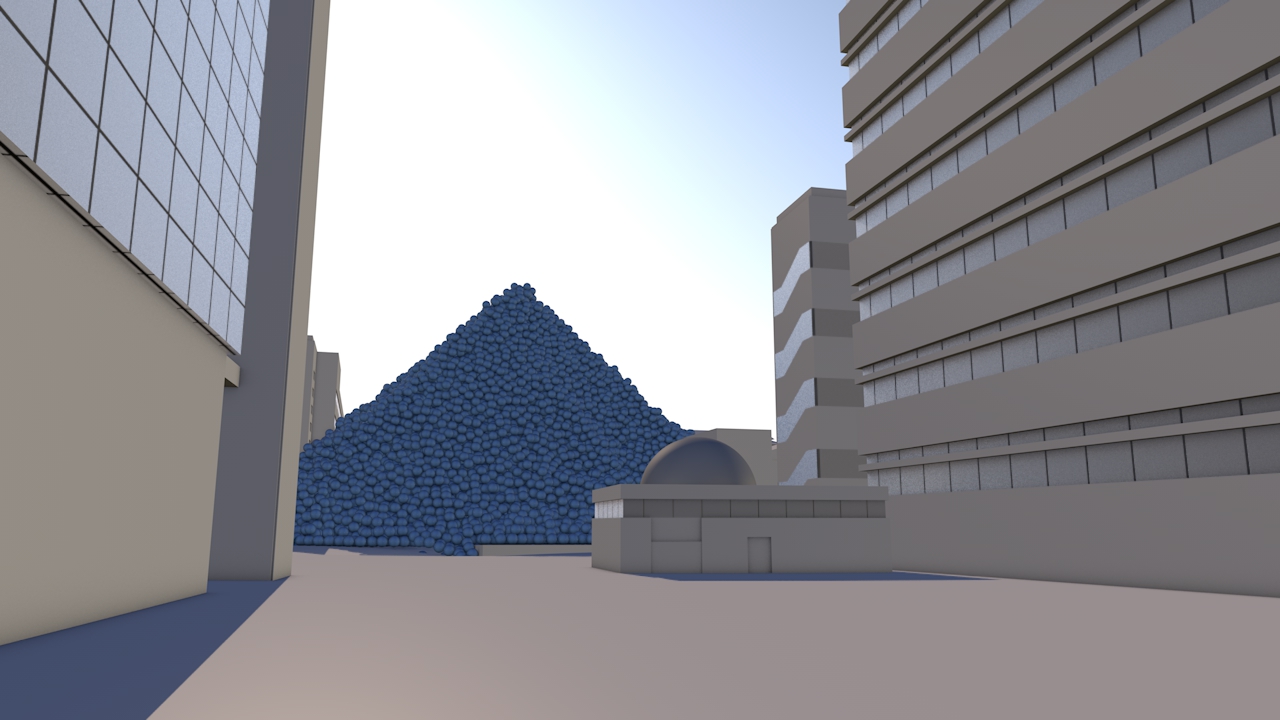
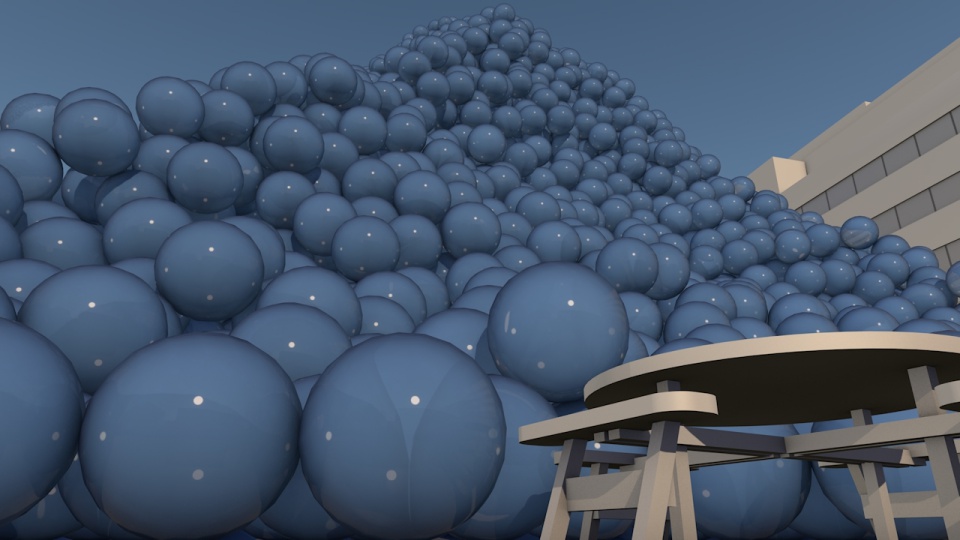
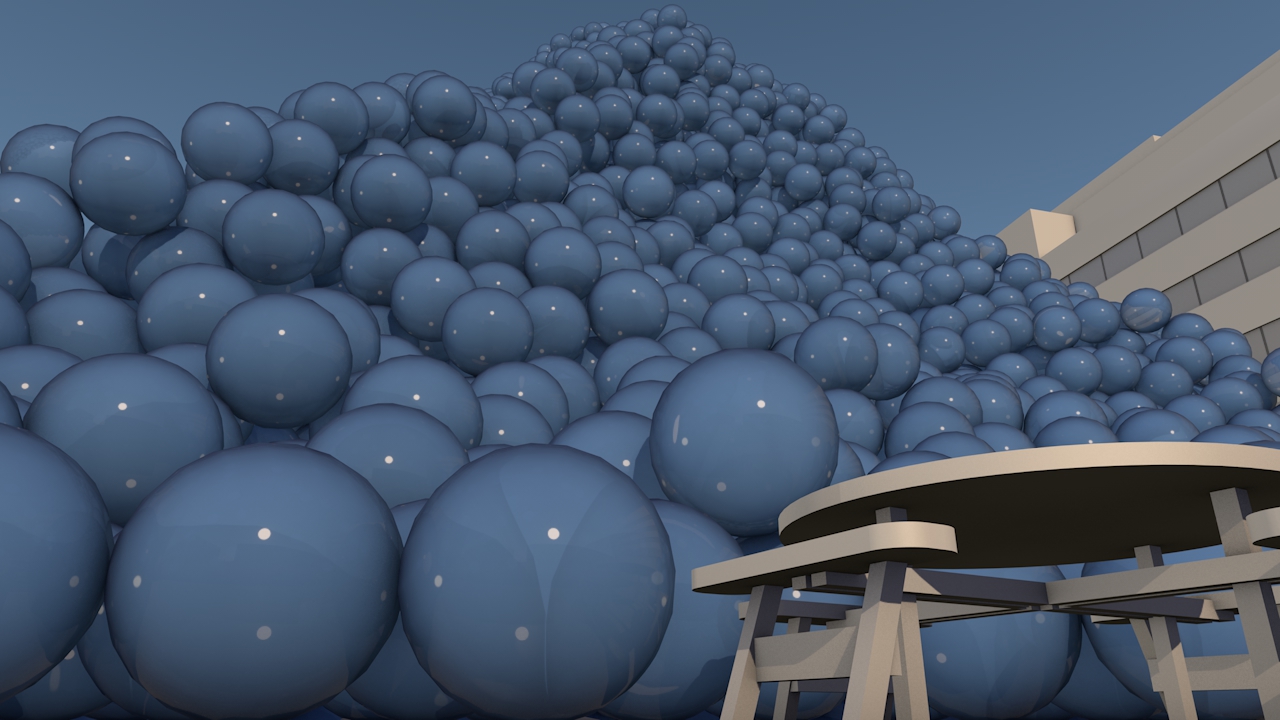
The University of Plymouth adds 11 thousand tonnes of carbon dioxide to the atmosphere every year. But what does that look like?

This animated film illustrates this footprint using the campus itself for scale and shows a ‘success’ story’ where emissions have been reduced.

The purpose of the video was to engage otherwise uninterested students, academics and staff, get them to realise that carbon emissions are real and show that the university is endeavouring to achieve measurable reductions. The intention is then to invite them to explore more detail through web-based energy and carbon dashboard.

The annual carbon reduction savings of 213,890 KgCO2e were achieved at the Babbage building after lighting and IT upgrade, installing voltage optimisation and connection to the Combined Heat & Power (CHP) plant. These savings are expected to equate to the annual emissions of the new Marine Building.


FURTHER INFORMATION

University of Plymouth Carbon Management Plan 2010 - 2015 here.

Sustainability pages for Plymouth University here.


Making sense of carbon, trees and timber

CLIENT

Wood for Good

PURPOSE

To find a new way to communicate the carbon benefits of using wood and timber in the UK construction sector.

DESCRIPTION

A series of short animated films and case study images using Wood for Good’s data to reach construction professionals, policy makers and the public.

The competence and skill you have in handling large data sets is absolutely fantastic. And you still delivered a wonderful set of visuals for us that we can continue to use for a long time to come.

Craig White Chairman, Wood for Good

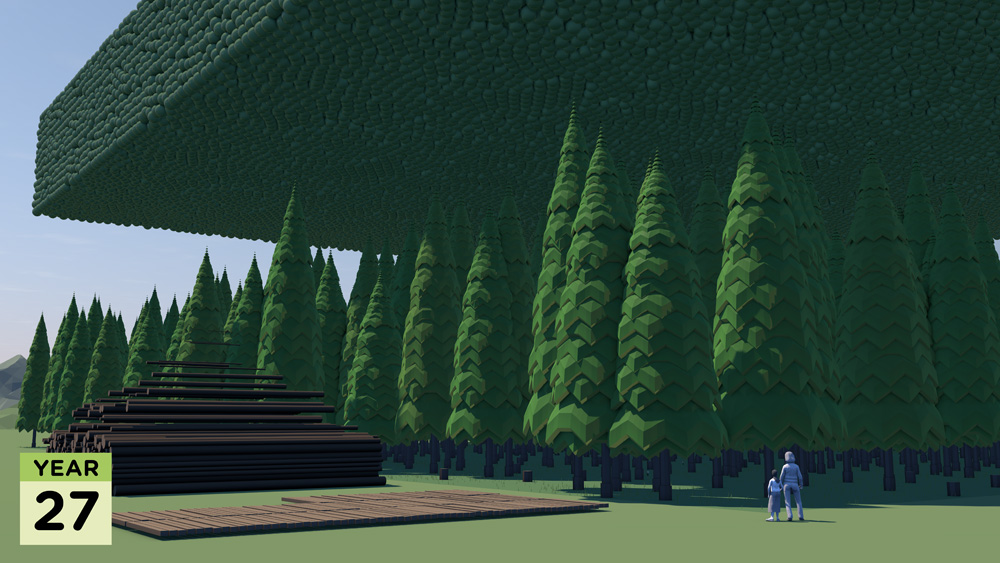
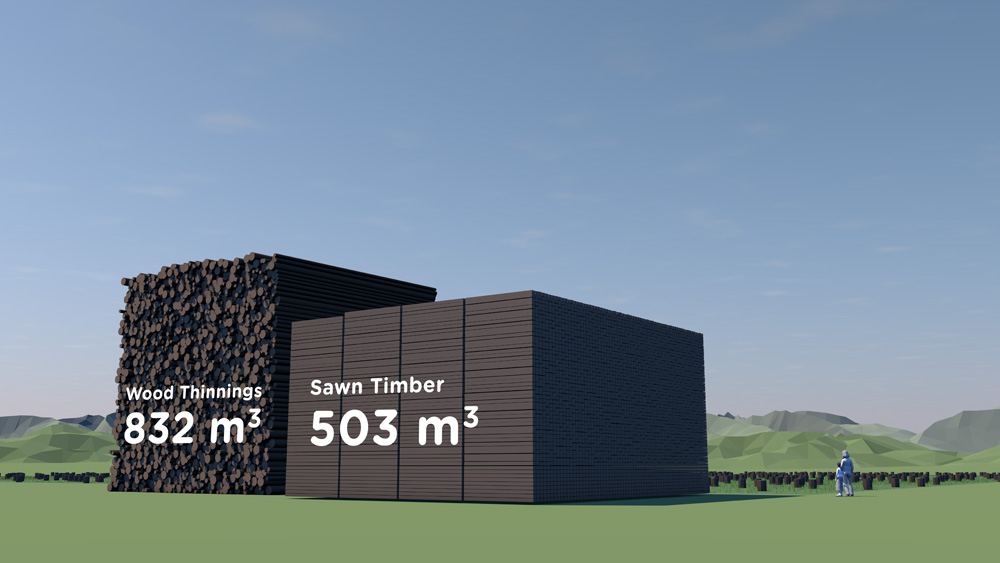
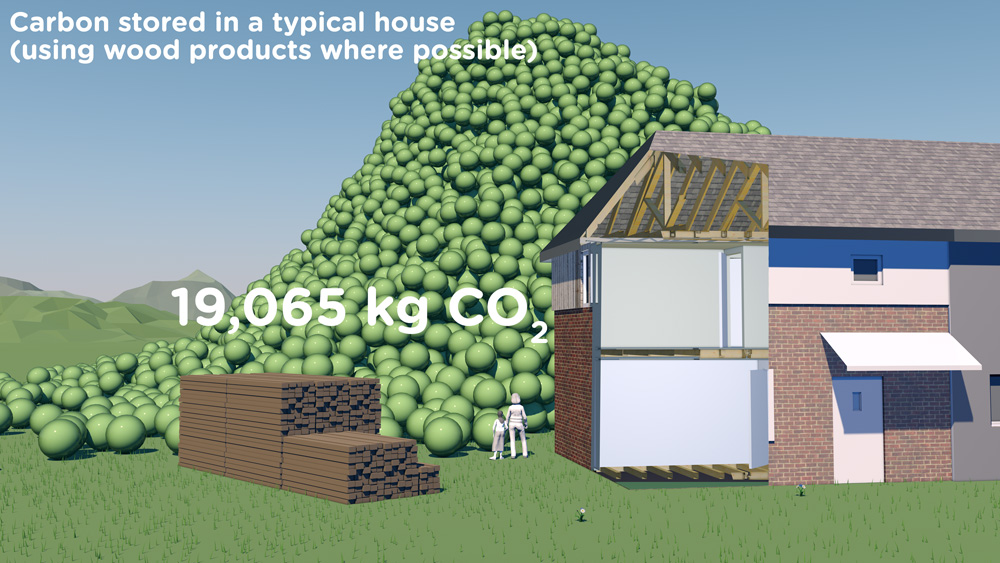
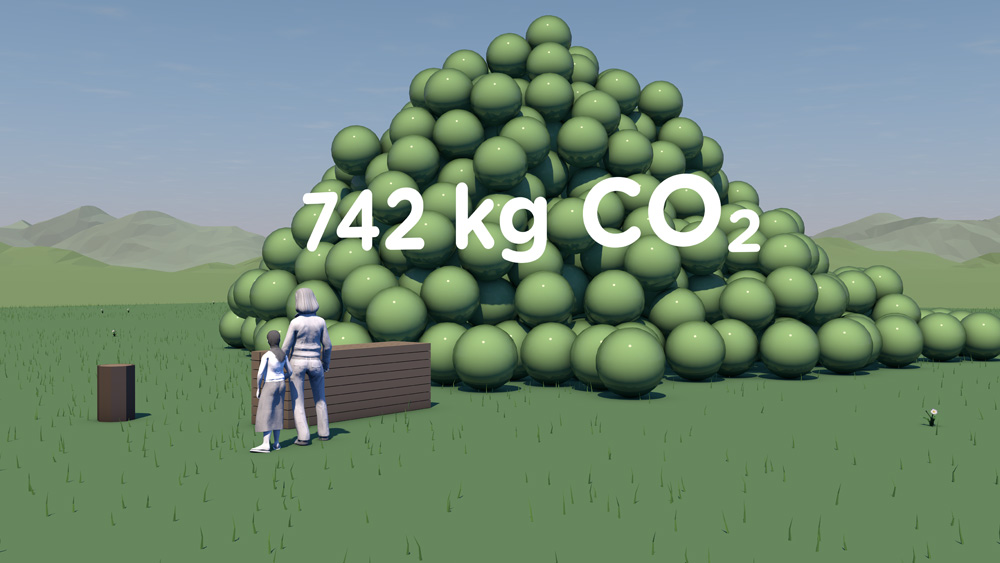
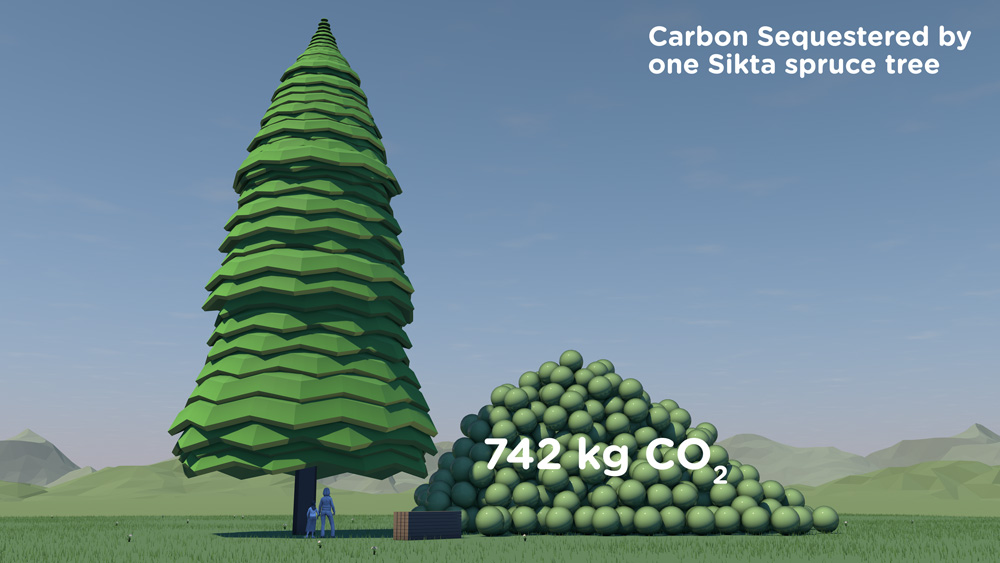
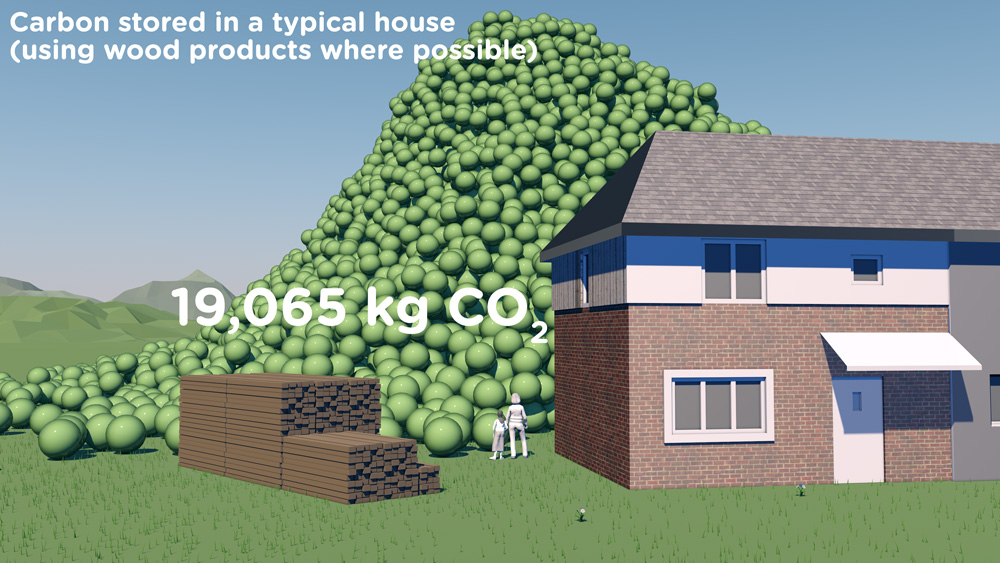
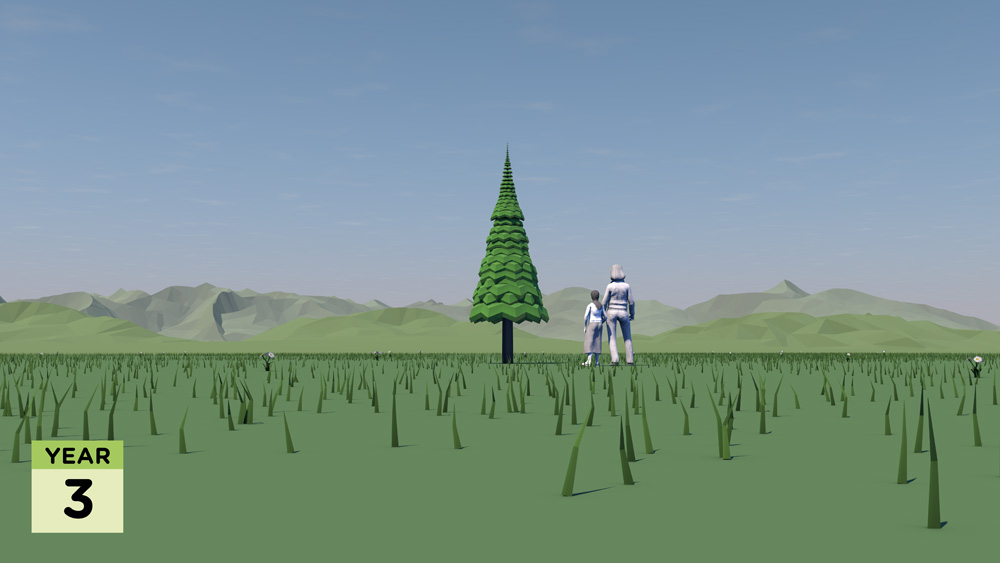
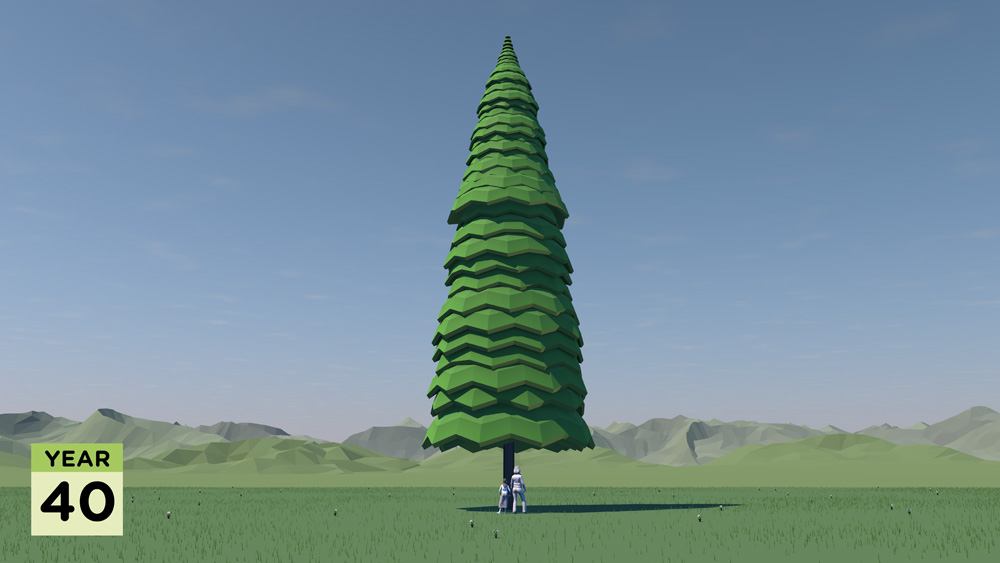
How much carbon is stored in a tree? How does that translate into cut timber and wood products? And how much carbon can be ‘banked’ by using timber for building houses in the UK?

These questions are raised and answered in a communication project that includes a series of short animated films and set of case study images created by Carbon Visuals for Wood for Good, the UK's wood promotion campaign.

The aim was to find a new way to communicate the positive carbon benefits of using wood and timber in the UK construction sector not just to construction professionals but also policy makers and the public.

Given the wide nature of the brief we agreed with the client to start the project with a scoping phase. During this, it was decided to split the film into three separate sections that could each work as short stand-alone films, rather than only as one single complex narrative. In addition we agreed to create a set of case study best practice images showing the carbon ‘banked’ in high profile buildings and timber products.

It has been very satisfying to shape and create a project which has both a business focus and important educational potential. I would like to see us working with more trade bodies and campaigns that have an important carbon message to get across.

Antony Turner, CEO Carbon Visuals

By liaising closely with the client in this initial phase we were able to spend time working up a communications plan, sourcing and examining appropriate data and creating draft film storyboards. This established a sound basis for the production schedule, culminating in all visual materials being ready for the campaign launch.

Data Sheet with methodology, data and references available here.

See Wood for Good website page here.

See our post-production video (giving insight from our clients on the project) here.

Animating the world's cars

A short animated film from Carbon Visuals is being used to engage managers around the world about the fundamentals of sustainability, how sustainability is relevant to their role and its importance to business success.Created for the University of Cambridge Institute for Sustainability Leadership (CISL), the film shows the current and expected resource use and parking space of all the world’s cars, as well as the CO2 emissions of cars today.

Gasoline from tar sands is different

The Environmental Defense Fund asked us to explain the difference between gasoline from tar-sands and regular gasoline in terms everyone can relate to. We compared them in terms of a single gallon of gas and a typical car's annual emissions. 

New York's carbon emissions - in real time

In 2010 New York City added 54 million metric tons of carbon dioxide to the atmosphere, but that number means little to most people because few of us have a sense of scale for atmospheric pollution.

Carbon Visuals, supported by Environmental Defense Fund, have created a film that makes those emissions feel more real - the total emissions and the rate of emission. Designed to engage the ‘person on the street’, this version is exploratory and still work in progress.

USA specific image set

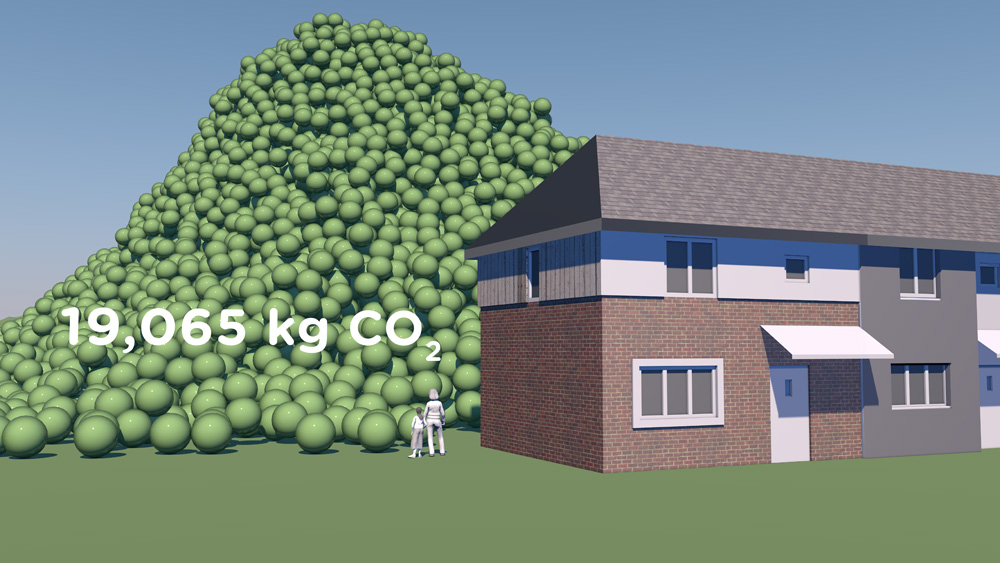
A set of simple images was created to give context to other visualisation projects we were carrying out for US-based Environmental Defense Fund.

Using a model of a typical US house, combined with US metrics - tons, gallons etc. - helps make the images more real for Americans.

Supporting carbon literacy at Plymouth University

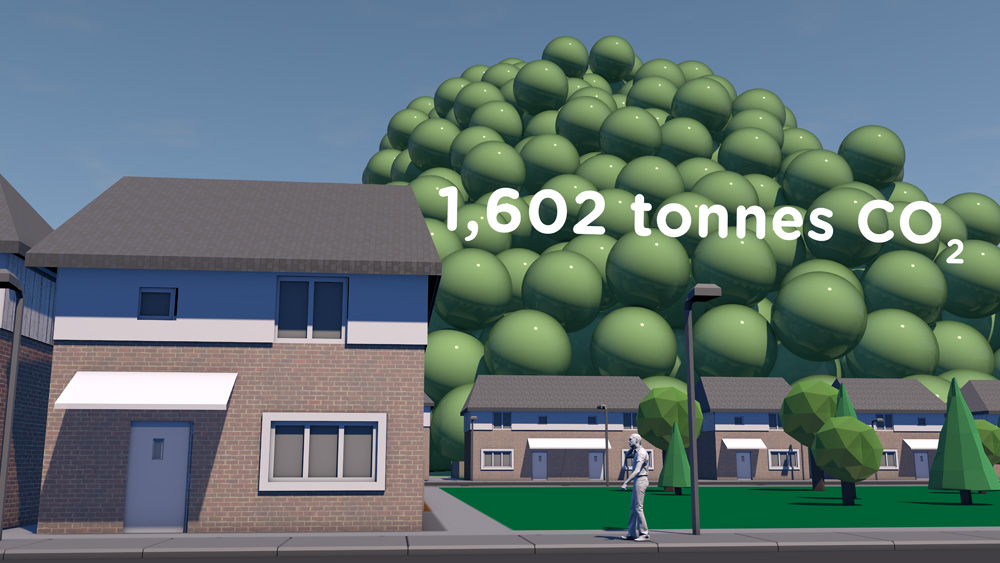
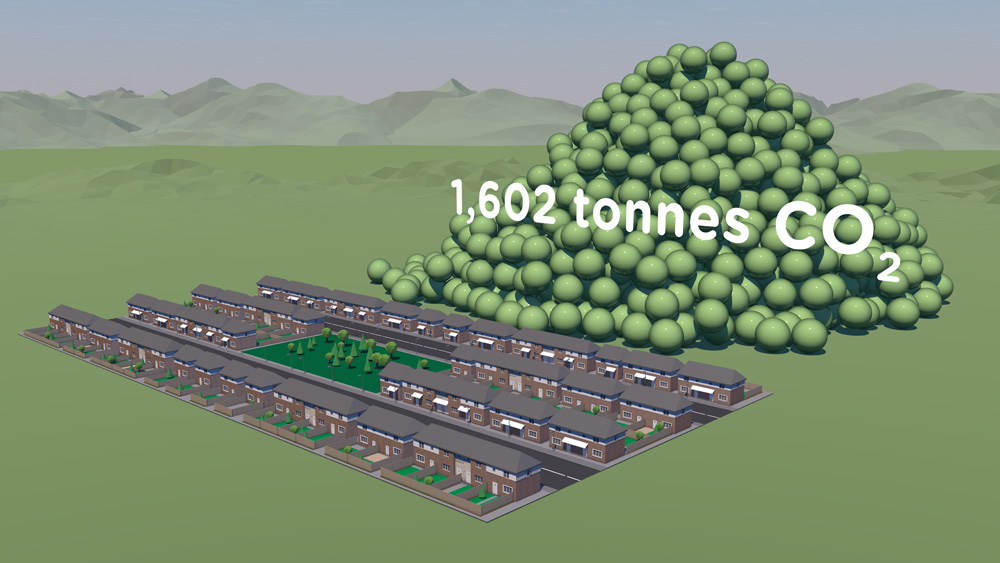
Carbon Visuals was invited to provide a set of images to illustrate the daily and annual carbon footprint of greenhouse gas emissions from selected buildings on the University of Plymouth campus.

The purpose of the project was to support carbon and energy-reduction activities by staff from the Estates Department. In addition the University is planning research to determine the effectiveness of this kind of communication with students, academics and staff.

The carbon footprint of the UK potato

CLIENT

ADAS

PURPOSE

To illustrate their capability to help farmers manage and reduce emissions.

DESCRIPTION

Film that combines live action and animation to explore the carbon footprint of the UK potato at personal and farm scales.

ADAS, the land and farming consultancy, wanted to compliment the earlier film that we made to illustrate emissions, sequestration & stored carbon on upland farms in the Peak District National Park. This time they were keen to illustrate their capabilities in helping mainstream farmers manage and reduce their carbon emissions.

The film explores the carbon footprint of the UK potato at the personal scale, as well as carbon saving potential at the farm scale.

More info from ADAS Carbon Management Team

To see all our work for ADAS, click here.

Carbon Visuals is keen to explore the use of film for helping everyone better understand carbon emissions from everyday activities. Please contact us if you have ideas.


Supporting BP's interactive carbon calculator for motorists


CLIENT

BP

PURPOSE

To encourage motorists reduce emissions from driving.

DESCRIPTION

Consultancy and visuals for a web calculator showing actual volumes of CO2 which change in size as reduction actions are chosen, with image set and methodology.

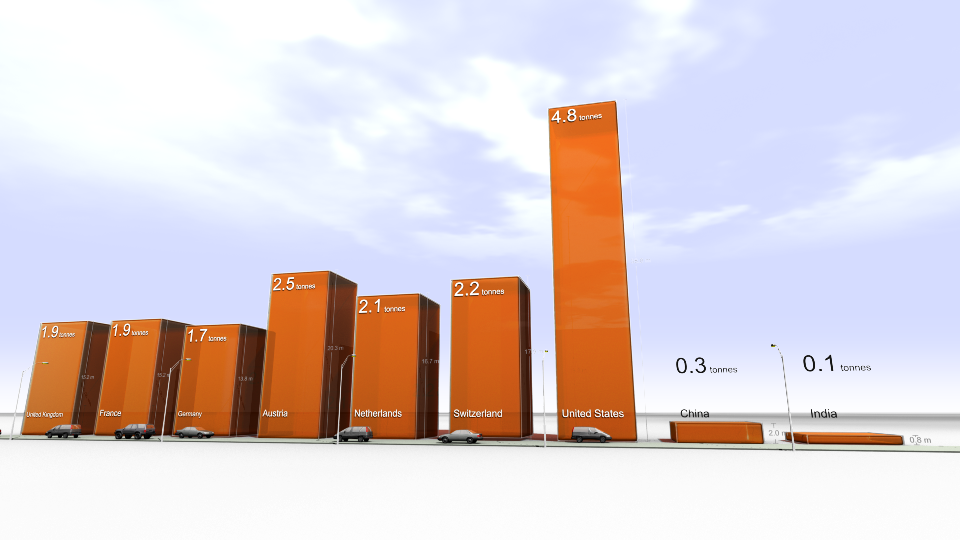
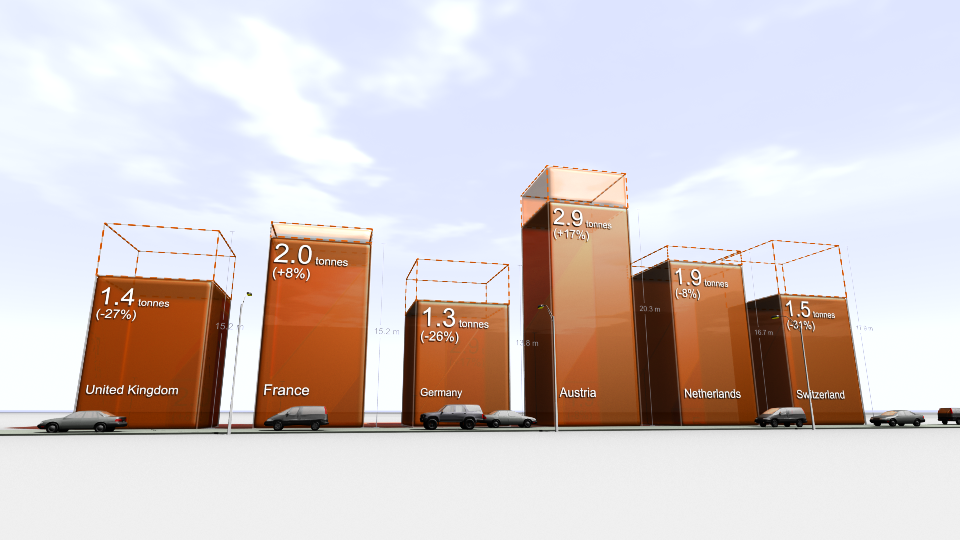
Carbon Visuals helped newly re-launched BP Target Neutral project by providing consultancy for the web calculator designed to help motorists reduce, replace and offset carbon dioxide from driving. The calculator, aimed at the general public, is the first in the world to show actual volumes of CO2 which change in size as different reduction actions are chosen. In addition carbon spheres can be compared against averages for other countries as well as the UK 'target' reduction for 2050.

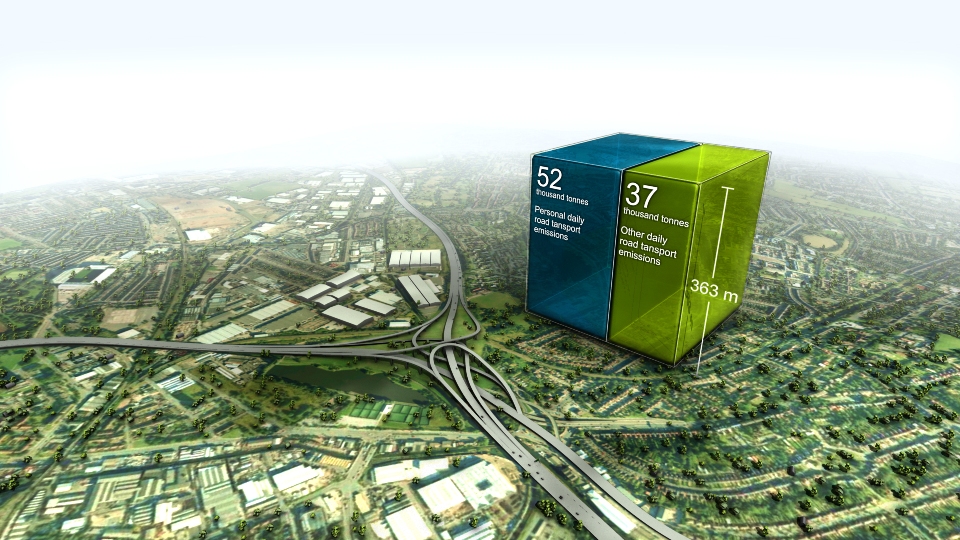
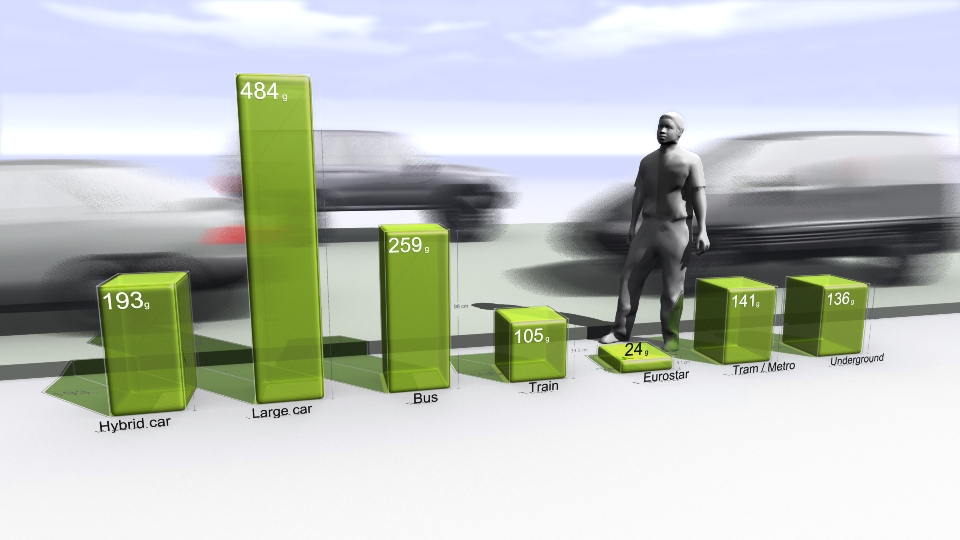
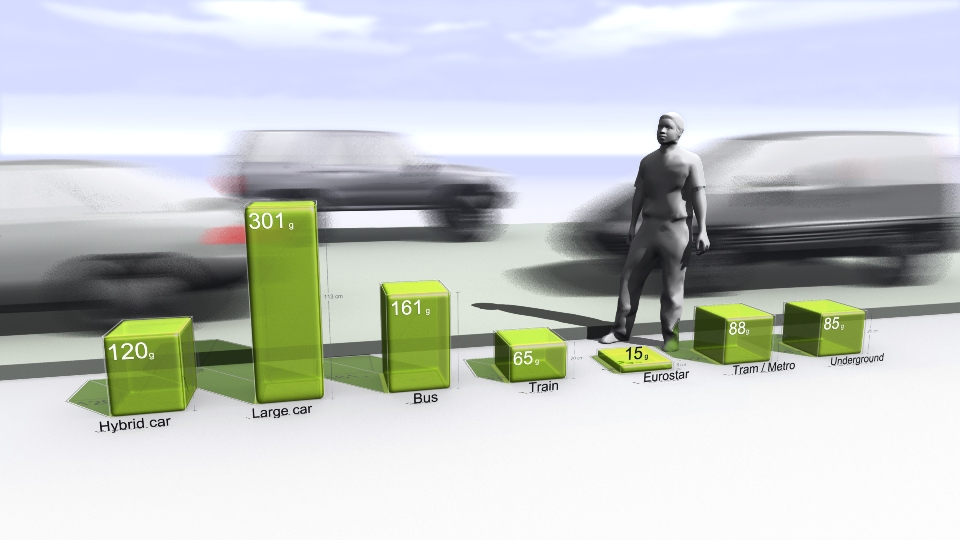
We also provided a number of bespoke images to highlight transport emissions in the UK, emissions of different transport types as well as transport emissions per capita for different countries.

Our Creative Director, Dr Adam Nieman also provided an overview of the importance of carbon visualisation

The first visual image uses Spaghetti Junction on the M6 near Birmingham as this basic ground. The familiar image from the British road network makes the immediate point that this is about roads, but then uses the recognisable scale to locate a cube-like shape showing the volume of carbon our cars, lorries and buses put into the atmosphere every day.

The cube presents this visually, while the simple captions fill in the specific details. This, the image is saying, is what 90,000 tonnes of carbon dioxide look like, and that’s what we’re pumping into the atmosphere every day. Suddenly the daily figure is something real and dramatic.

The BP Target Neutral Methodology PDF outlines the data, calculations and assumptions in the image set.