Adam Nieman has created a series of images as part of a residency at the Create Centre, Bristol, April-June 2012. The exhibition coincided with Bristol's Big Green Week, an annual event that engages the public in green issues and actions.
The carbon footprint of one hour's TV production
CLIENT
BBC
PURPOSE
To illustrate the emissions resulting from TV production for an industry conference at White City.
DESCRIPTION
Animation that shows the real-time emissions associated with making one hour of broadcast ready production, and image set.
The television industry is taking steps towards addressing sustainability issues associated with TV productions. A key tool, created by the BBC and made available through a partnership with BAFTA, is Albert - a bespoke carbon calculator.
Carbon Visuals was commissioned by the BBC to produce a set of images and a real-time animation showing the emissions resulting from one hour of TV programming. The data was provided by about 80 productions that were the first to use the Albert calculator at the BBC.
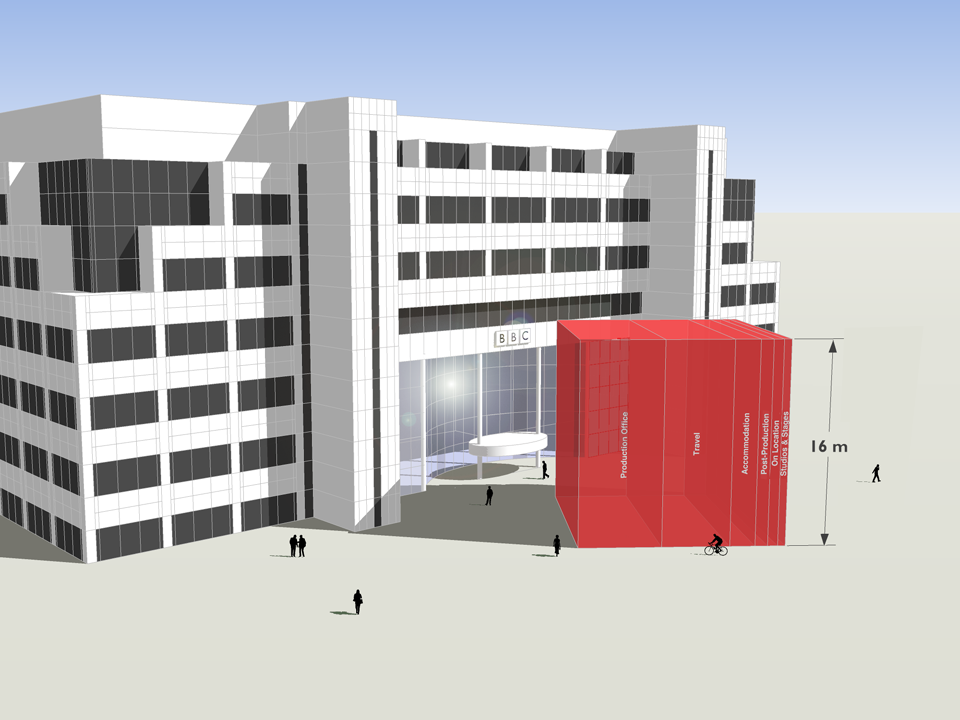
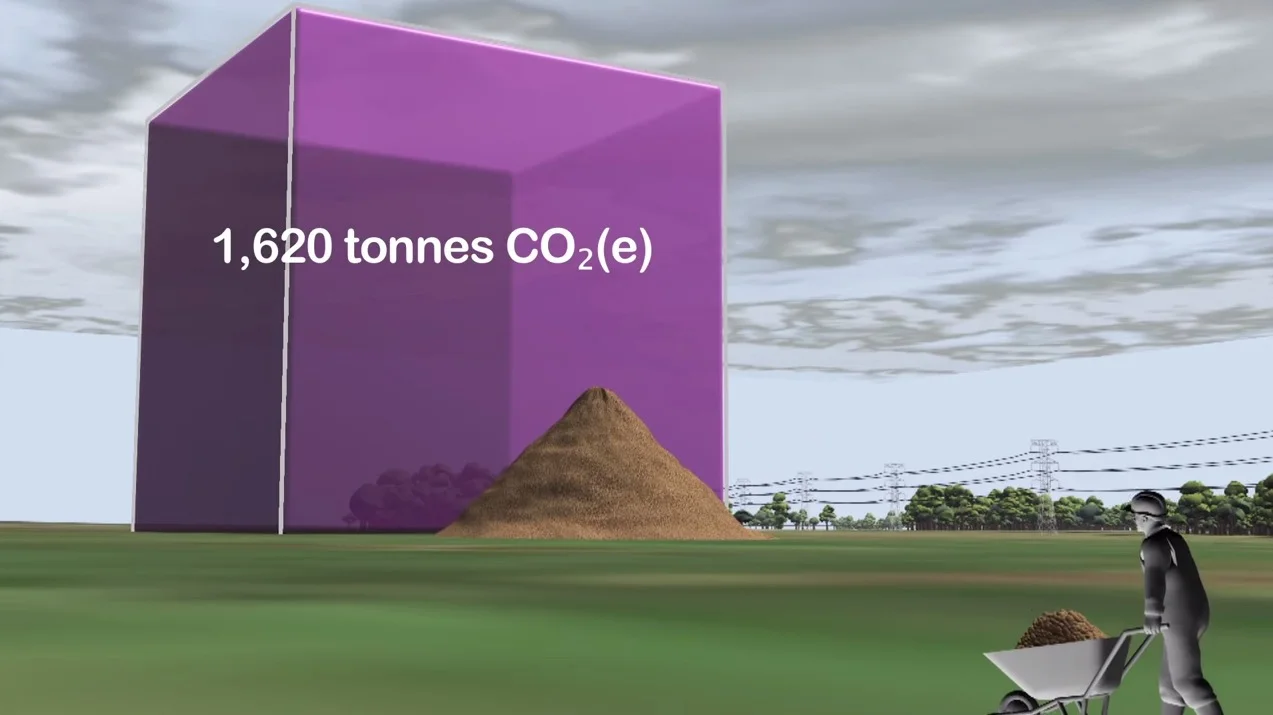
This animation was created for the BBC and shows the real-time emissions associated with making one hour of broadcast ready production - equivalent to about 8.2 tonnes of carbon dioxide.
Average emissions associated with the major stages of a production are here shown in order of size and as a whole, depicted in front of the BBC White City building.
These visuals were first shown at an industry conference, which took place in the iconic BBC White City building that is depicted here, on 3rd November 2011.
The PDF illustrates the emissions of different parts of the production process.
Albert was developed & trialed within the BBC in 2011, with production managers and coordinators providing data on about 80 programmes. While there were considerable variations between productions, the average (mean) rate - about 8.2 tonnes of carbon dioxide per hour - provides a first attempt at establishing a figure against which programme makers will be able to gauge progress in future.
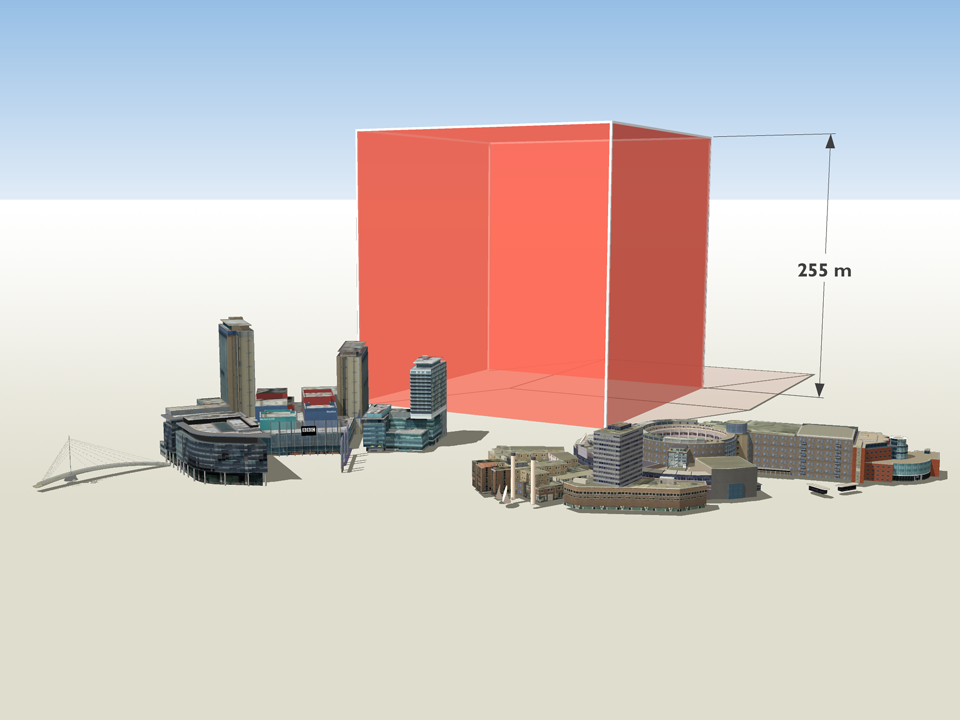
Annually within the BBC, about 3,800 hours of TV are produced in-house. An annual volume of emissions, based on the average rate per production hour for programme emissions calculated using Albert, is here shown with familiar BBC buildings in Salford and London for scale.
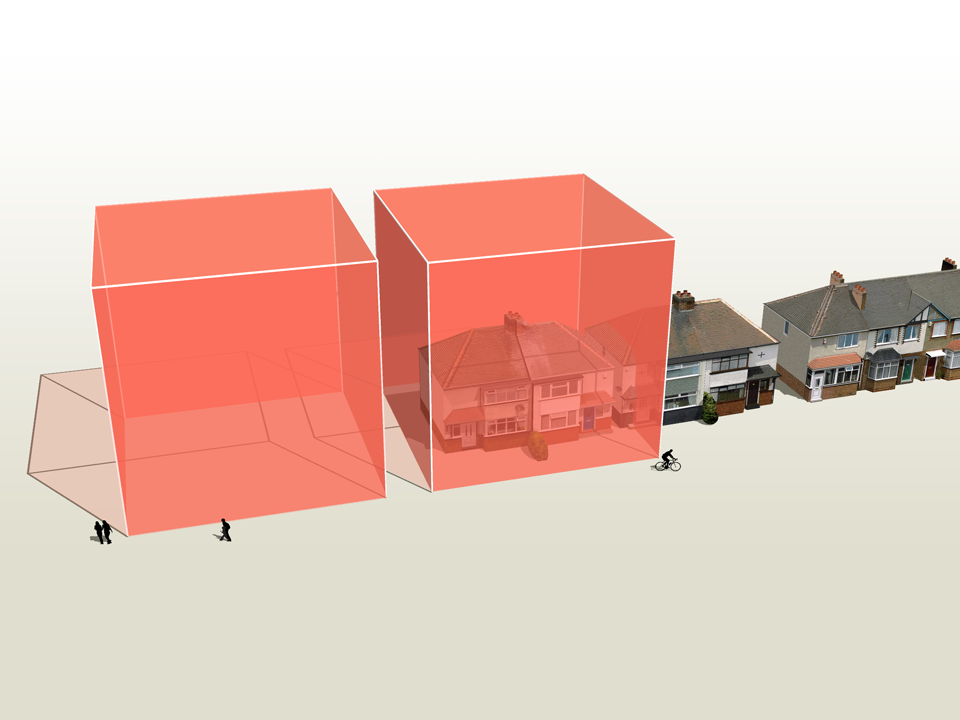
The average (mean) rate of emissions associated with TV production, based on data from about 80 programmes, is about 8.2 tonnes of carbon dioxide per hour.
This is roughly equivalent to the annual emissions associated with space heating, heating and lighting for a pair of semi-detached houses (figures provided by the BBC).
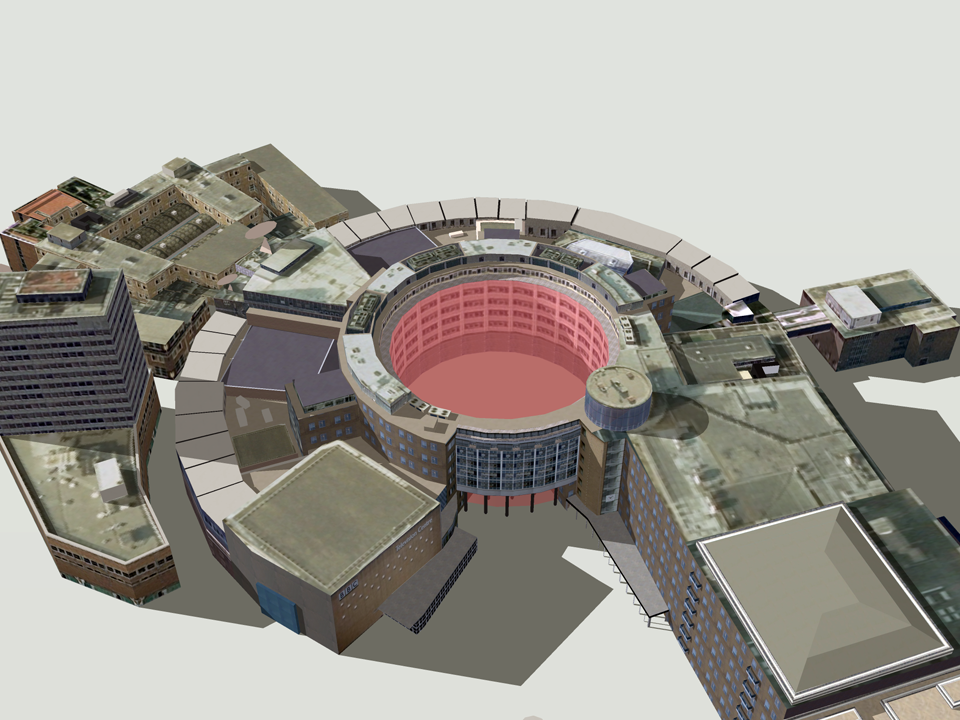
Based on the average rate per production hour for programme emissions, 11 hours of production time would fill the void in the centre of the BBC Television Centre in London - a space that is well-known to production teams.
The carbon footprint of the UK potato
CLIENT
ADAS
PURPOSE
To illustrate their capability to help farmers manage and reduce emissions.
DESCRIPTION
Film that combines live action and animation to explore the carbon footprint of the UK potato at personal and farm scales.
ADAS, the land and farming consultancy, wanted to compliment the earlier film that we made to illustrate emissions, sequestration & stored carbon on upland farms in the Peak District National Park. This time they were keen to illustrate their capabilities in helping mainstream farmers manage and reduce their carbon emissions.
The film explores the carbon footprint of the UK potato at the personal scale, as well as carbon saving potential at the farm scale.
More info from ADAS Carbon Management Team
To see all our work for ADAS, click here.
Carbon Visuals is keen to explore the use of film for helping everyone better understand carbon emissions from everyday activities. Please contact us if you have ideas.
Supporting BP's interactive carbon calculator for motorists

CLIENT
BP
PURPOSE
To encourage motorists reduce emissions from driving.
DESCRIPTION
Consultancy and visuals for a web calculator showing actual volumes of CO2 which change in size as reduction actions are chosen, with image set and methodology.
Carbon Visuals helped newly re-launched BP Target Neutral project by providing consultancy for the web calculator designed to help motorists reduce, replace and offset carbon dioxide from driving. The calculator, aimed at the general public, is the first in the world to show actual volumes of CO2 which change in size as different reduction actions are chosen. In addition carbon spheres can be compared against averages for other countries as well as the UK 'target' reduction for 2050.
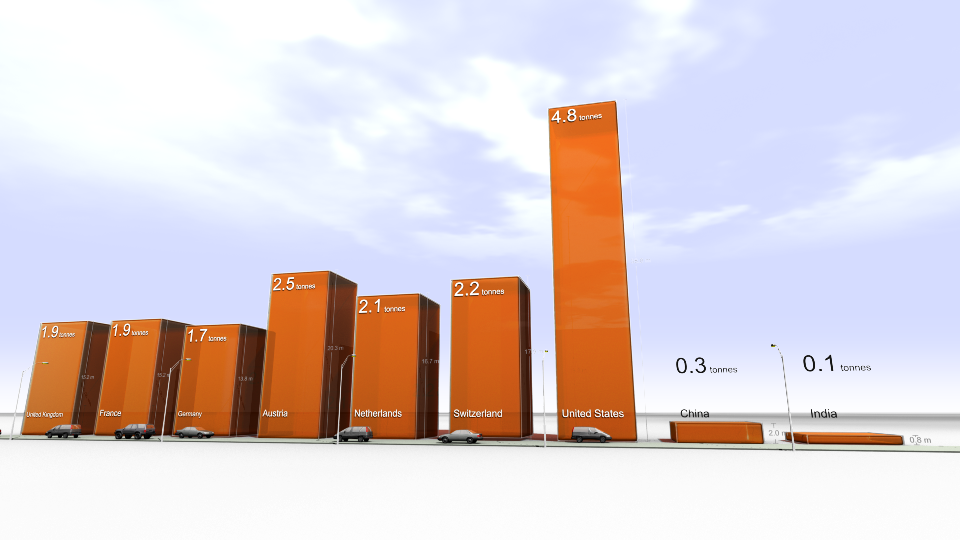
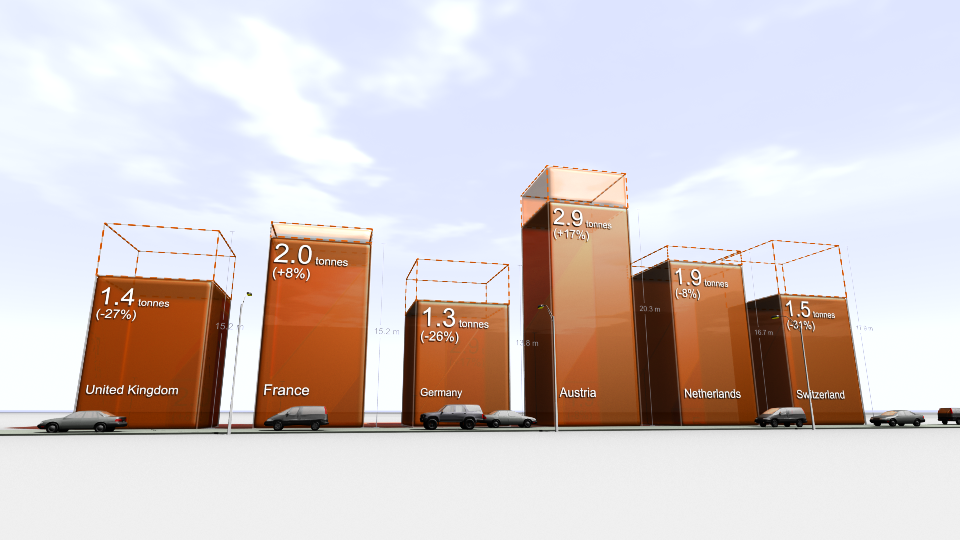
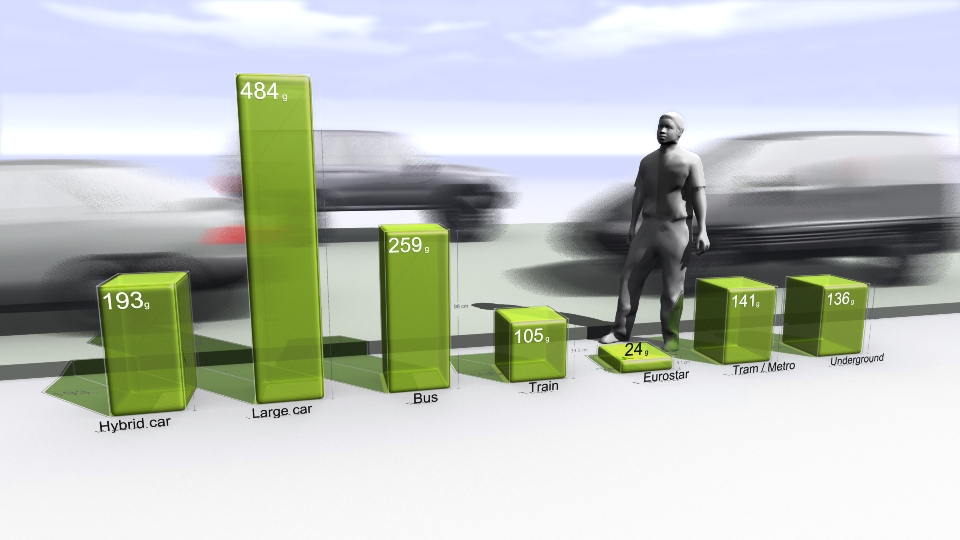
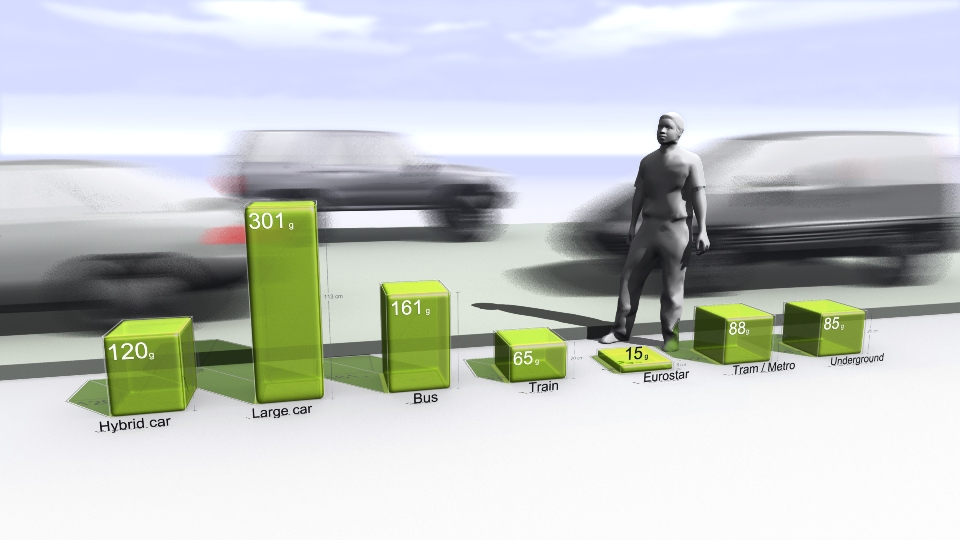
We also provided a number of bespoke images to highlight transport emissions in the UK, emissions of different transport types as well as transport emissions per capita for different countries.
Our Creative Director, Dr Adam Nieman also provided an overview of the importance of carbon visualisation
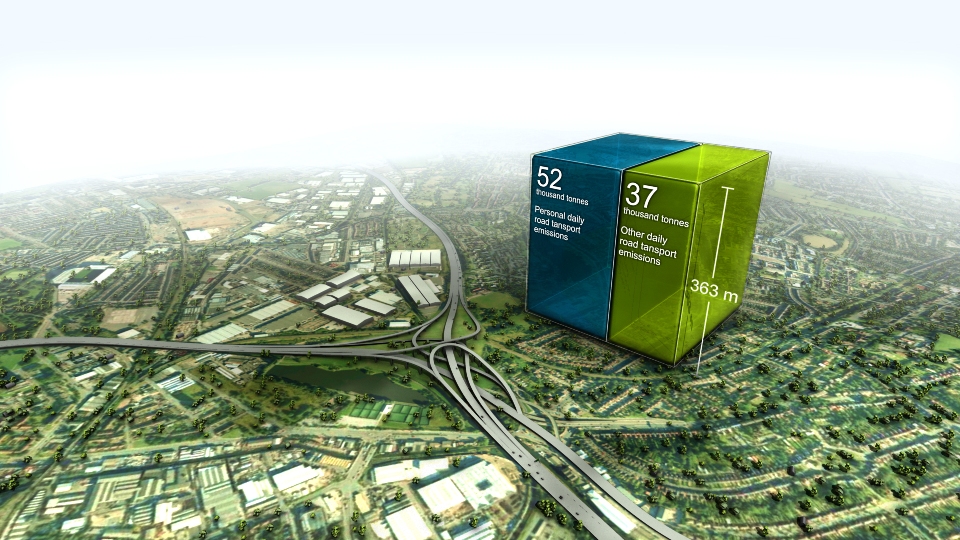
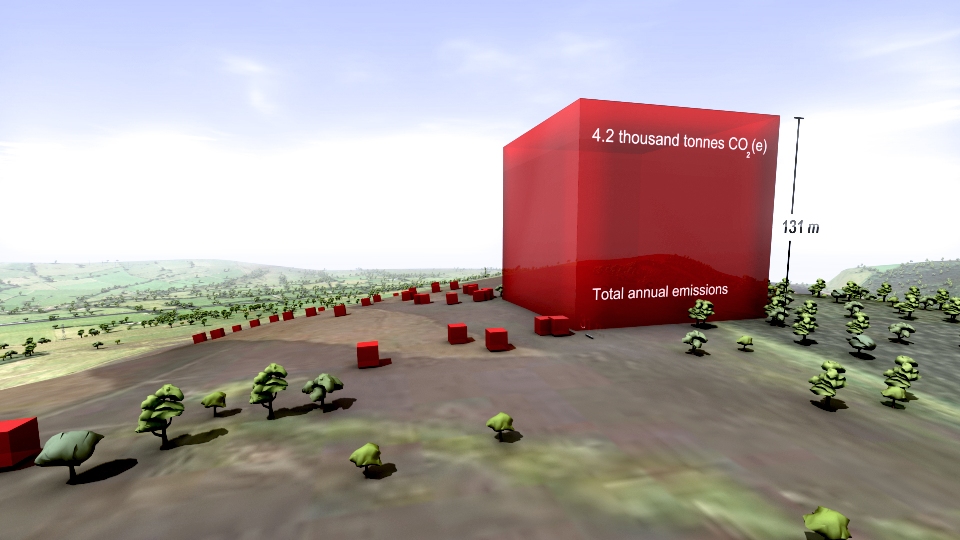
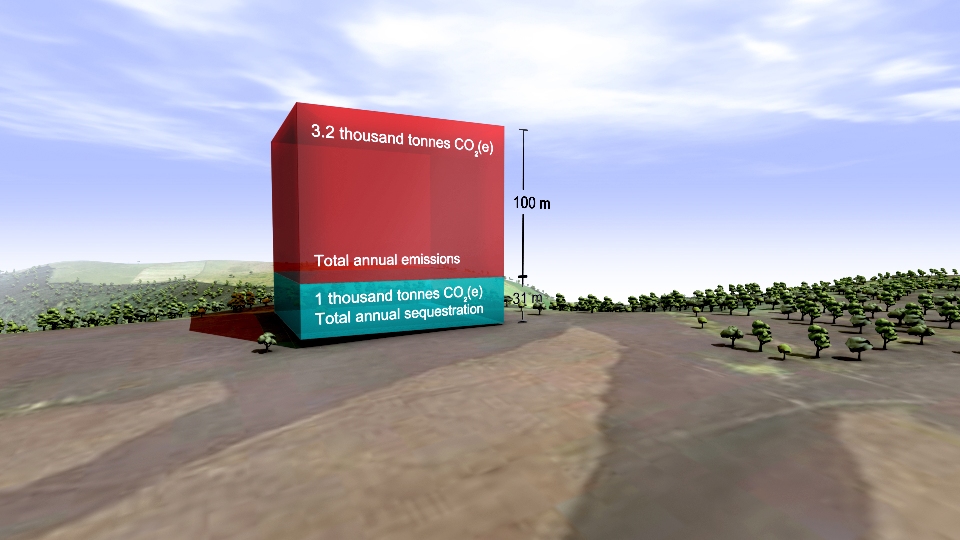
The first visual image uses Spaghetti Junction on the M6 near Birmingham as this basic ground. The familiar image from the British road network makes the immediate point that this is about roads, but then uses the recognisable scale to locate a cube-like shape showing the volume of carbon our cars, lorries and buses put into the atmosphere every day.
The cube presents this visually, while the simple captions fill in the specific details. This, the image is saying, is what 90,000 tonnes of carbon dioxide look like, and that’s what we’re pumping into the atmosphere every day. Suddenly the daily figure is something real and dramatic.
The BP Target Neutral Methodology PDF outlines the data, calculations and assumptions in the image set.
Emissions, sequestration & stored carbon on upland farms
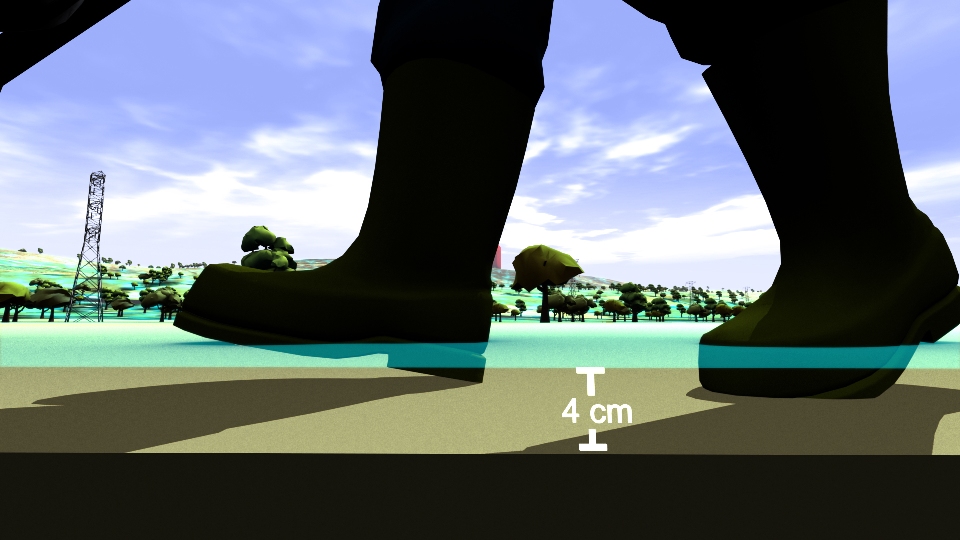
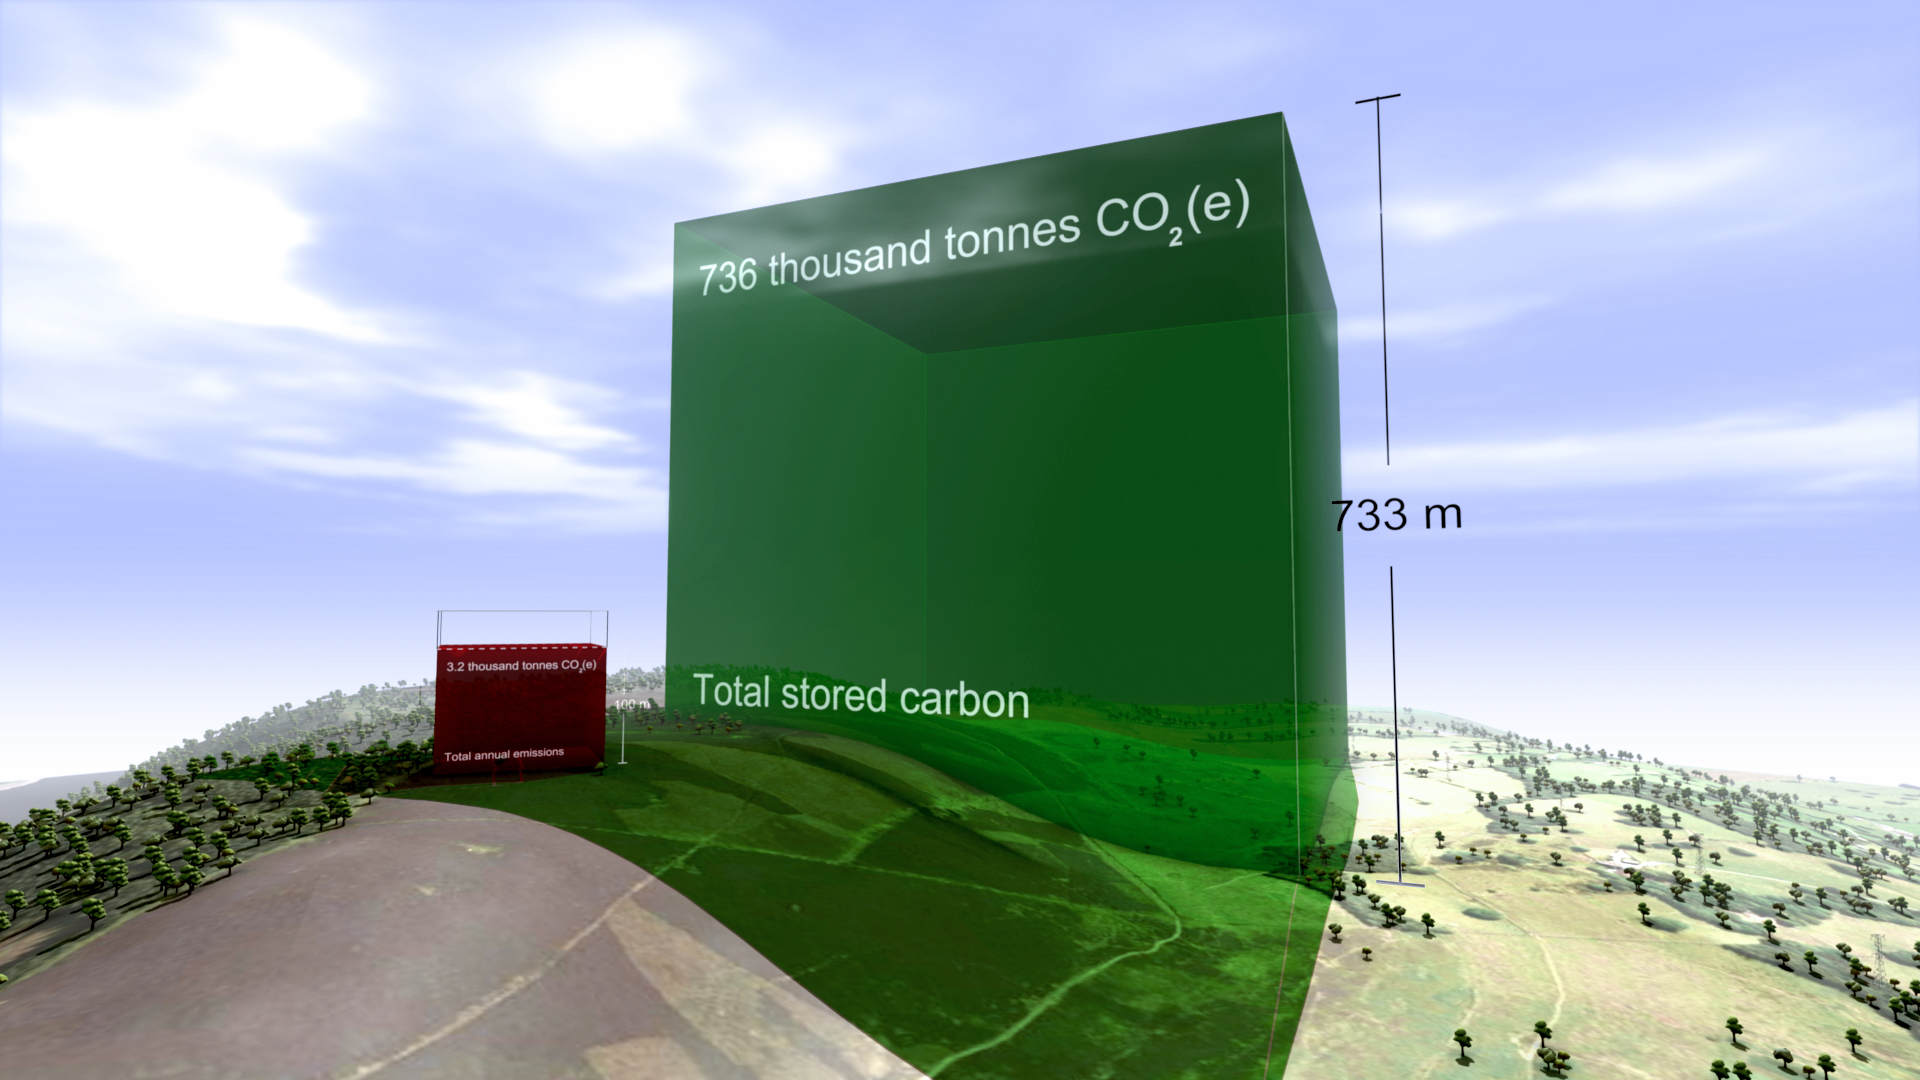
Carbon Visuals have created this short animation film to show the emissions, sequestration & stored carbon on ten upland farms in the Peak District National Park. The farms extend over 1,500 hectares and comprise part moorland, part pasture.
The data was taken from ADAS Report Environmental Quality Mark (EQM) Farm Carbon Footprint and Water Audit Pilot Project.
The core message from the film is that these farms are not only producing food and preserving the landscape. They are performing an important role as guardians of a huge carbon store that is best kept in soils and vegetation.
We believe that this is a 'world first' for this type of medium. Created for the consultancy ADAS, the film demonstrates the potential for moving animation to communicate complex carbon stories.
The film is being used to engage a variety of stakeholders including ADAS staff, farm managers and agricultural policymakers.
To see all our work for ADAS, click here.
If you like this approach, and feel that it would suit your particular carbon communication challenge, then please contact us.
Global CO2 emissions in real time
How can you give people some sense of the rate at which we are adding emissions to the atmosphere?
Using 2010 data, we calculated that at standard pressure and 15oC the mean rate of emissions for that year would fill a volume the size of the UN Secretariat Building roughly seven times every four seconds. Working with our associate Lucy Blackwell we created a simple experimental low resolution animation which we have shown to live audiences on numerous occasions.
Some people find it “breath-taking”.