city

UK 80% reduction target – in Piccadilly Circus

CLIENT

UK Department of Energy & Climate Change (DECC)

PURPOSE

Use social media to get young people interested in a 70 page report.

DESCRIPTION

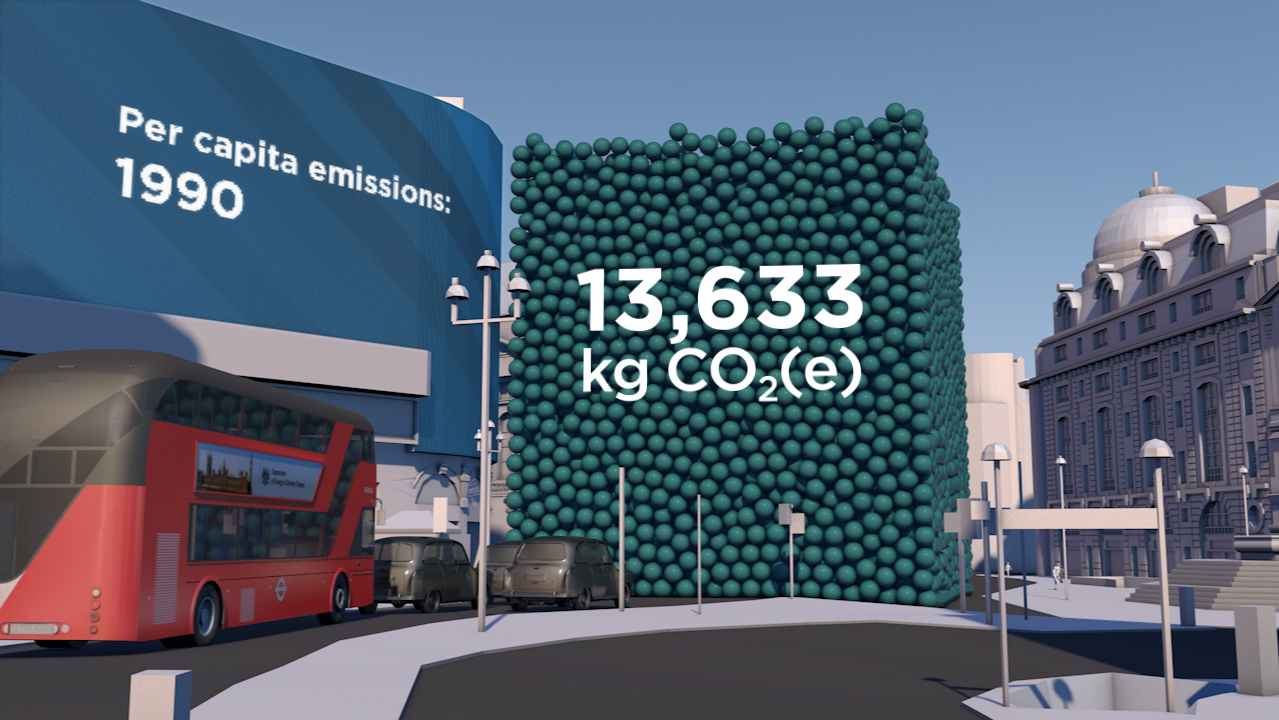
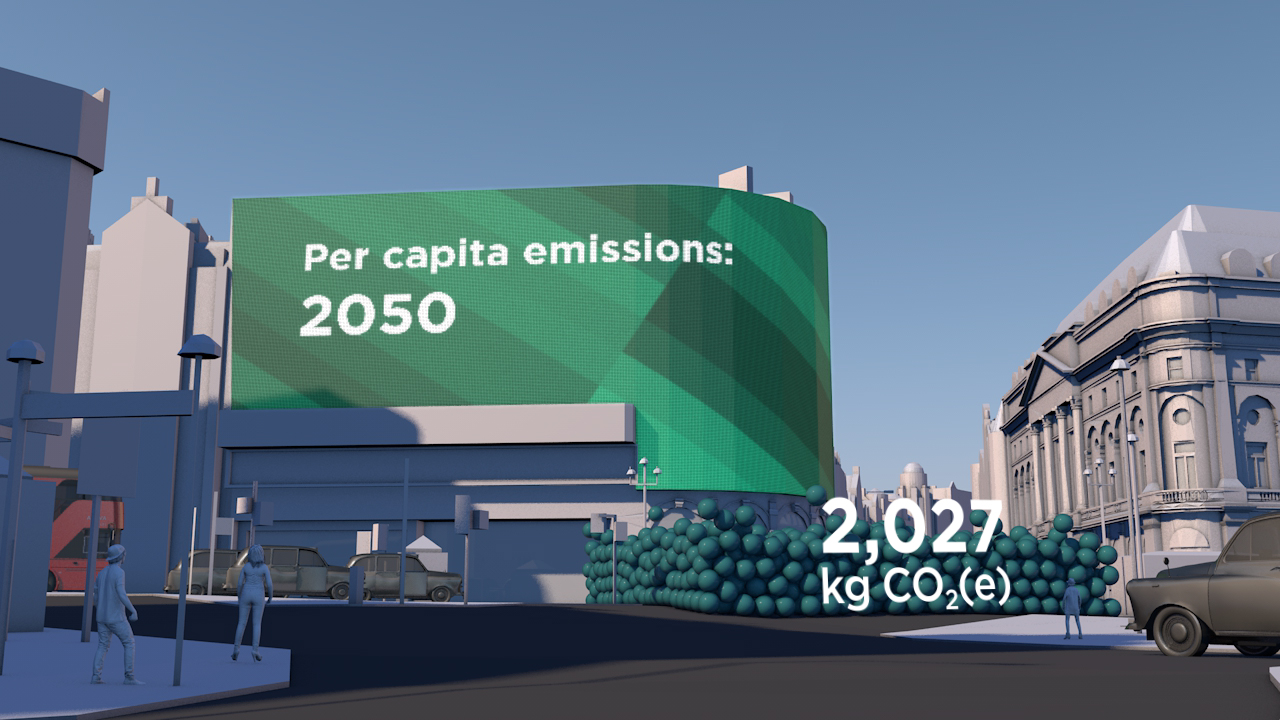
An animated drama set in Piccadilly Circus – a popular and iconic gathering place for young and all. The scene is transformed into a memorable moving picture that shows the UK Government’s 2050 target on the scale of one person.

We are very happy with the film, and particularly thrilled that it was our first Vine and had 5000 loops in 5 days.

David Armstrong, Head of eCommunication & Digital Media, DECC

How do you create a stir on Twitter and other social media to get interest in a 70 page Report?

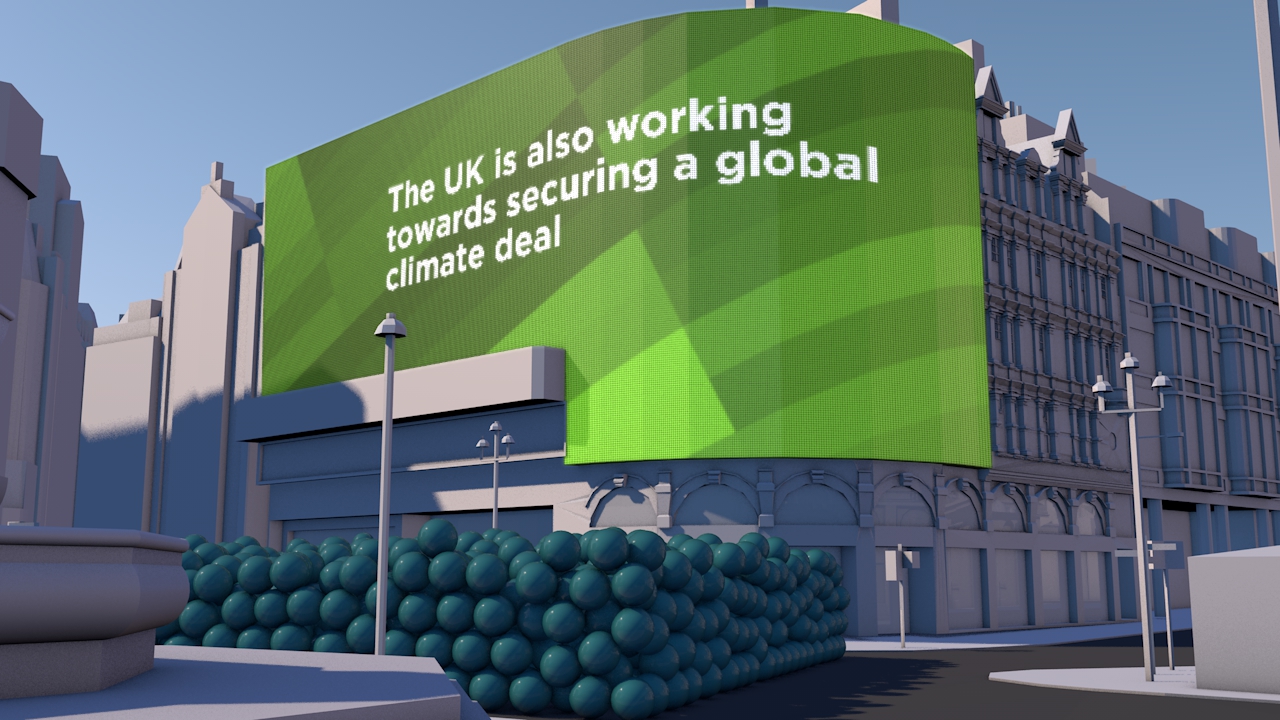
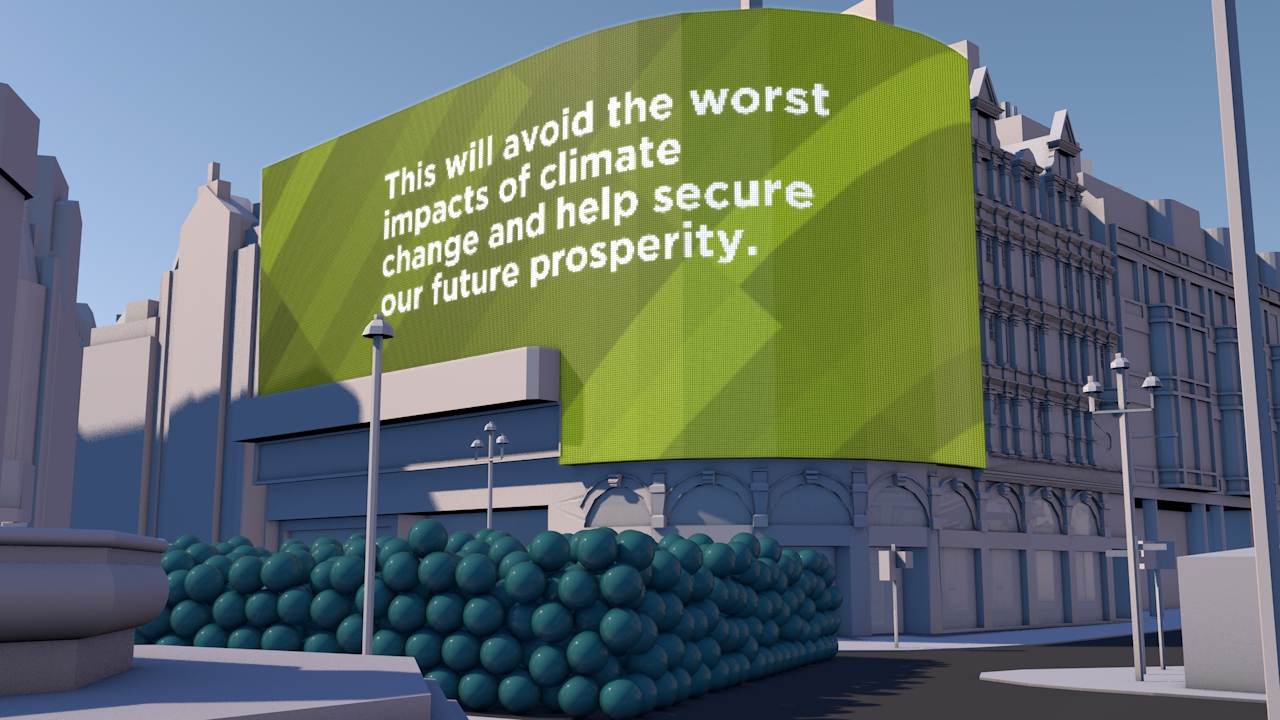
That was the task facing the UK Department of Energy & Climate Change (DECC) who wanted to commission a compelling image set and short animation to draw attention to a new Report - Paris 2015: Securing Our Prosperity Through a Global Climate Change Agreement.

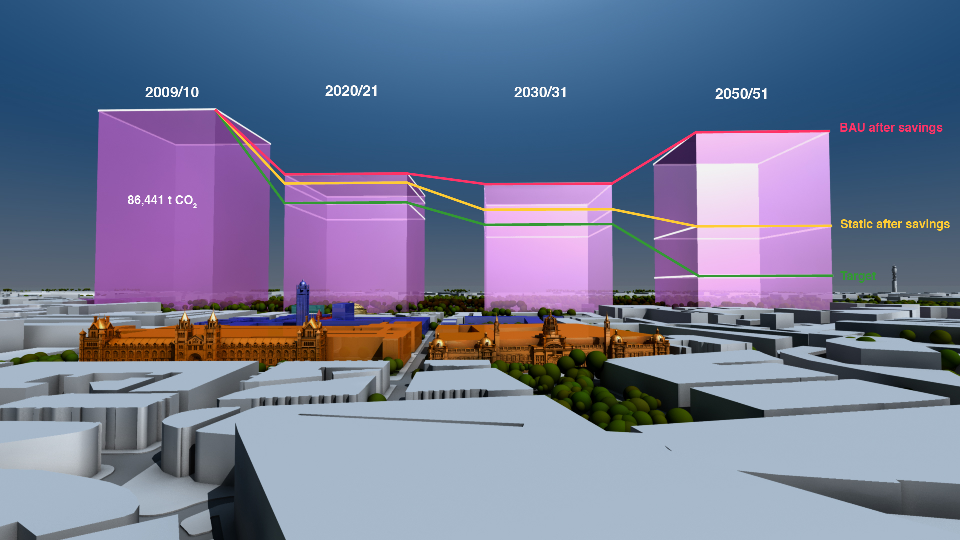
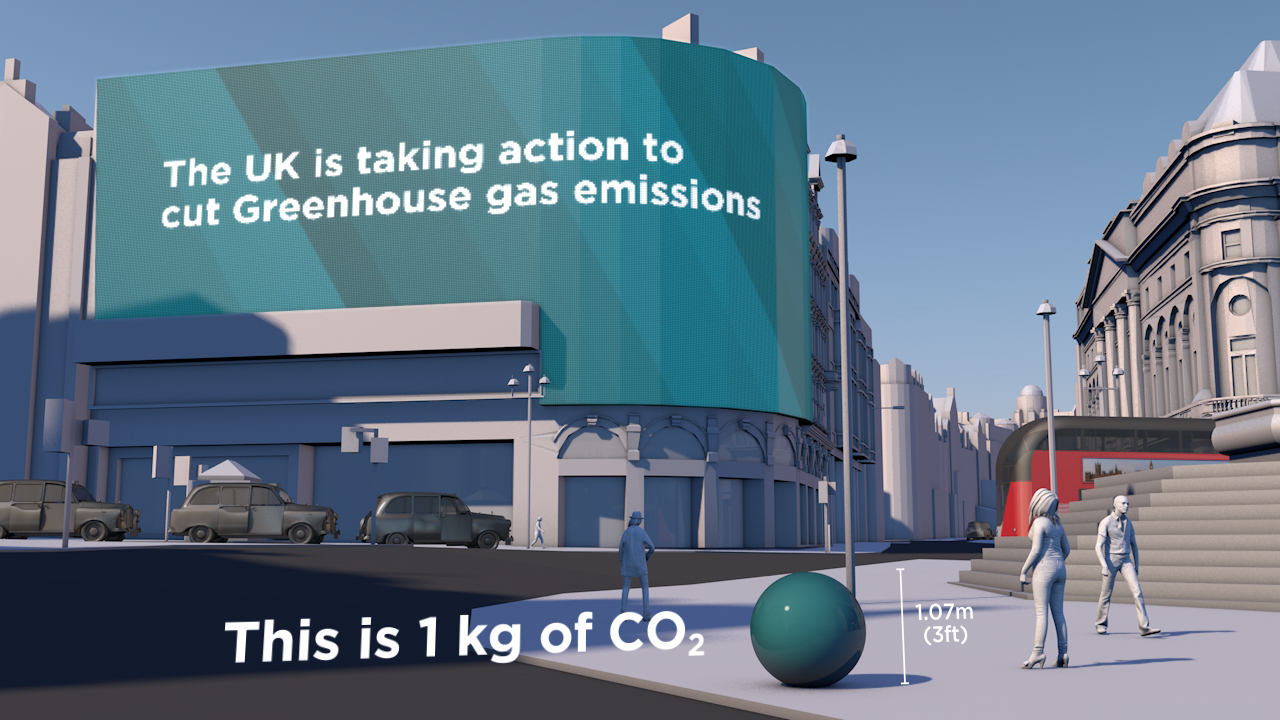
A fast turn-round meant an immediate focus on a key compelling message that could be visualised. Fortunately the UK government has a particularly positive message on carbon - with an 80% reduction target for 2050 enshrined in law. So we set about clarifying the data and thinking through visualisation ideas.

The result: a visual drama set in Piccadilly Circus – a popular gathering place for young and all and itself a unique and iconic location. With captions and messaging appearing as adverts, this immediately recognisable scene is transformed into an eye-catching and memorable moving picture that shows the target on the scale of one person.

See Number 10 Storify page for these images in use.

See video on YouTube. See VINE version

Technical Notes

Raw numbers:

UK Population 1990: 57,237,500

UK Population 2050 (projection): 77,000,000

GHG Emissions 1990: 777.6 MtCO2e

Derived values:

2050 target emissions (80% reduction): 155.52 MtCO2e

Per capita emissions 1990: 13,586 kg

Per capita emissions target 2050: 2,020 kg

Per capita saving target (1990 to 2050): 11,566 kg

Population figures and projections come from Office for National Statistics (ONS); GHG emissions from DECC.

Mapping local air pollution in New York

Visual images created by Carbon Visuals are being used to help New York property managers, building co-op boards and community groups reduce local air pollution from their buildings.

Around 8,000 buildings in New York City have been burning heavy heating oil. These contribute more soot pollution than all cars and trucks on the City’s roads. The NYC Clean Heat program seeks to improve air quality and save lives in New York by eliminating heavy oil use and accelerating the adoption of cleaner fuels

New York's carbon emissions - in real time

In 2010 New York City added 54 million metric tons of carbon dioxide to the atmosphere, but that number means little to most people because few of us have a sense of scale for atmospheric pollution.

Carbon Visuals, supported by Environmental Defense Fund, have created a film that makes those emissions feel more real - the total emissions and the rate of emission. Designed to engage the ‘person on the street’, this version is exploratory and still work in progress.

The carbon canyons of New York

Seventy five percent of New York City's greenhouse gas emissions come from the energy used by buildings. Reducing this energy is a goal of both building managers and the City of New York itself.

This visualisation takes data about the carbon emissions of municipal buildings in New York City and transforms it into a 3D map of the actual volume of carbon dioxide added to the atmosphere. It co-opts the city itself to serve as its own data visualisation.

Telling the story of a city's emissions

Adam Nieman has created a series of images as part of a residency at the Create Centre, Bristol, April-June 2012. The exhibition coincided with Bristol's Big Green Week, an annual event that engages the public in green issues and actions.

Illustrating carbon reduction potential for South Kensington 1851 Estate

CLIENT

Natural History Museum, Science Museum, V&A, Imperial College and Royal Albert Hall

PURPOSE

To illustrate the carbon reduction potential for the South Kensington 1851 Estate.

DESCRIPTION

Striking image set, to illustrate the Carbon Reduction Masterplan launched by the Minister of State for Energy and Climate Change.

Carbon Visuals has created a set of striking images to illustrate the carbon reduction potential for the South Kensington 1851 Estate. Organisations involved include the Natural History Museum, the Science Museum, the Victoria and Albert Museum, Imperial College, the Royal Albert Hall, the Royal College of Music and the Royal College of Arts.

These prestigious institutions came together in 2005 to embark on an inspirational long-term carbon reduction plan. Phase One involved laying the foundations and creating a realistic strategy. The Masterplan, launched in November 2011, marks the conclusion of that phase and the commencement of its realisation.

Carbon Visuals aided communication amongst the parties and with external stakeholders by creating striking imagese at various stages of the project.

Creating a computer generated model of the Estate enabled a wide range of different images to be created - wide angle, close-up, aerial and ground level.

To see the context in which the images were used feel free to download the PDF of the overview brochure.

UK Government departments exceed their 10% CO2 reduction targets


Carbon Visuals was commissioned by DECC to produce a set of high-resolution Google Earth images to illustrate Government department carbon footprints and reduction targets. The total carbon dioxide emissions between May 2010 and May 2011 amounted to 646,231 tonnes, which is 13.8% less than the previous year. This is what that looks like.

The actual volume of carbon dioxide gas emitted by the UK Government in 2010/11 (red volume). The saving on 2009/10 - the gas that didn't enter the atmosphere - is shown as the dashed volume. The target is shown as a red band.

See the Government press release here:www.decc.gov.uk/en/content/cms/news/pn11059/pn11059.aspx

Download the PDF with more info