biomass

Resource efficiency in Asia Pacific

CLIENT

United Nations Environment Programme

PURPOSE

To convey the scale and complexity of resource use in the Asia Pacific region at a conference of Environment Ministers and subsequently to other audiences.

DESCRIPTION

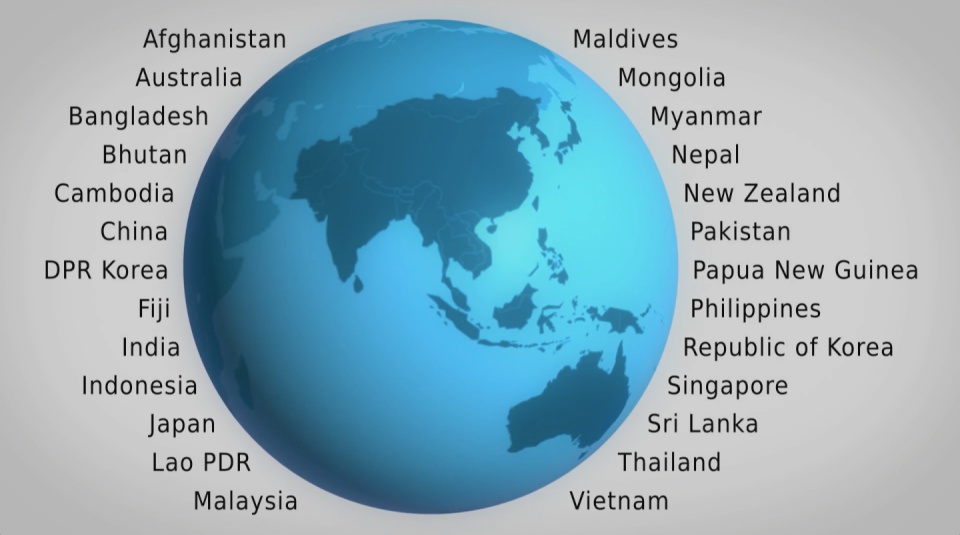
A high impact video and interactive web-tools to introduce and enable easy exploration of a database covering 26 Asia Pacific countries, 157 indicators and 40 years.

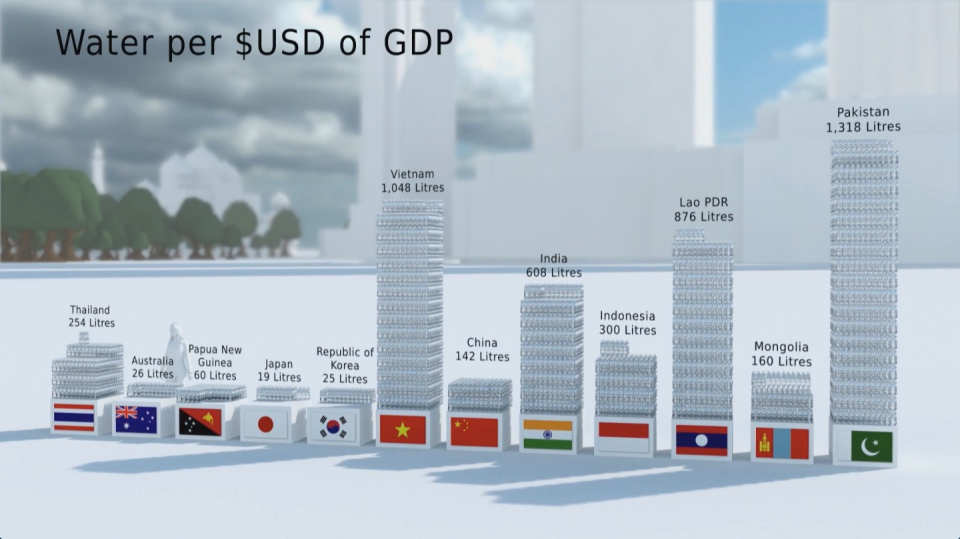
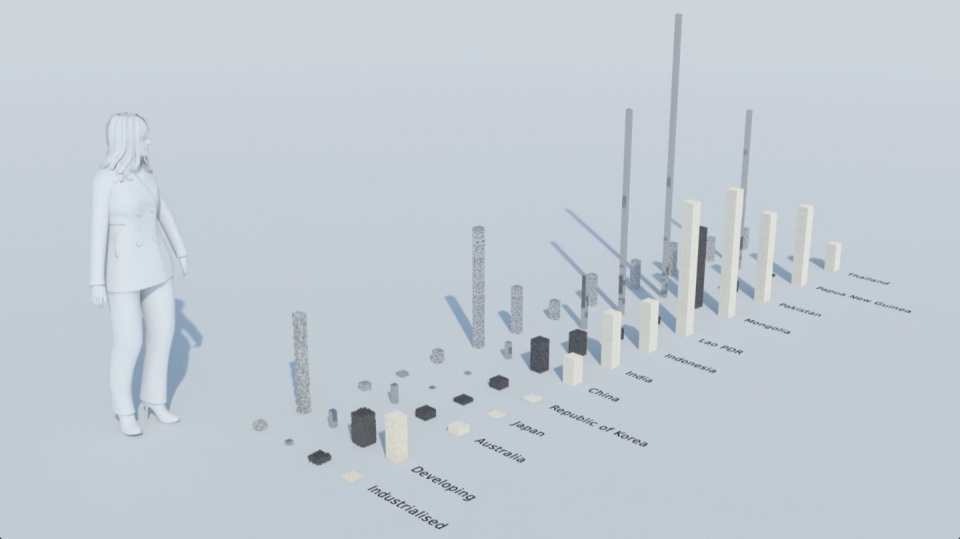
How much natural resources are used to earn one dollar in developing countries in the Asia Pacific region? How do you effectively show water, metal and biomass usage rates across 26 Asian countries - and make it personal and real? What is the best way to visualise a range of environmental resource indicators ‘per GDP’ across countries?

These were some of the challenges set for us by the United Nations Environment Programme (UNEP) in a project undertaken in conjunction with our not-for-profit partner CarbonSense Foundation.

This video has taken our communications to a higher level, and improved our ability to cut across a crowded policy landscape to really help decision makers reflect on resource efficiency.

Janet Salem, UNEP, Bangkok

The brief from the UNEP Bangkok office was to design and create a short, high impact video to convey the scale and complexity of resource use in the Asia Pacific region. In addition a set of interactive web-tools is being provided to complement the film and allow easy exploration of the data.

The film is supporting a database of resource efficiency data covering 26 Asia Pacific countries, 157 indicators and 40 years (1970-2010). The indicators are designed to inform policy development in the region based on the principles of circular economy, sustainable consumption and production principles.*

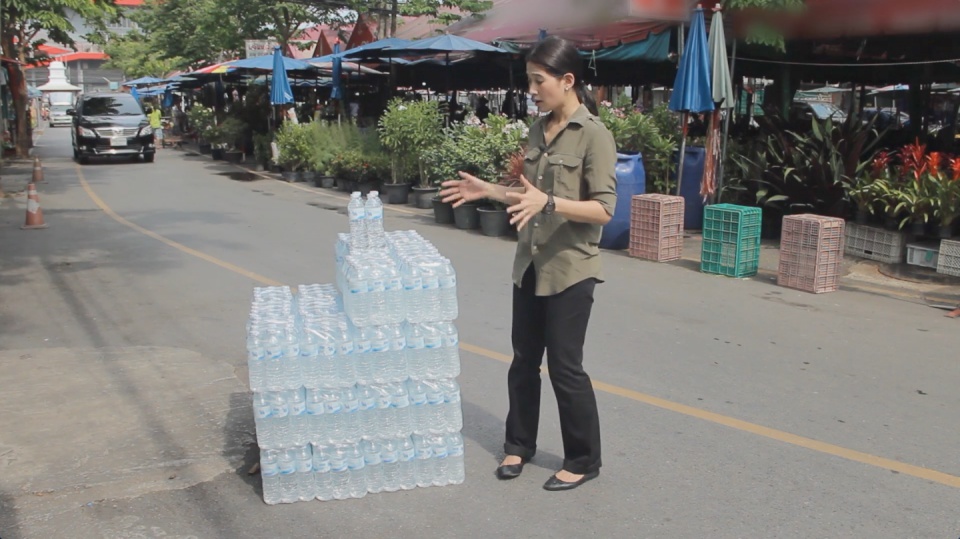
Resource efficiency is crucial for sustainability but how do you make it real and meaningful at a national and a personal level? To bring such a huge subject up front and personal, we combined live action film introducing very real piles of materials on a table-top with national and regional resource use and impacts made tangible with CGI graphics. And uniquely this project allowed us to explore ways that our creative techniques could be combined with economic data.

Because of the complexity of data and fast-track time schedule the project was carried out in a highly collaborative way, with UNEP staff in Bangkok supporting our creative team throughout the scoping, design and production phases.

The film was used to launch the UNEP Report at a conference on 19th May 2015 attended by Achim Steiner, Executive Director of UNEP, and Environment Ministers and policy makers from the Asia Pacific region.

See the UNEP webpage on project here

Finally - a very special thanks to Janet Salem of UNEP, Bangkok and our film presenter / narrator Patchari Raksawong.

*The database has been developed as a result of a three-year science-based consultative process mandated by countries in the region and coordinated by UNEP, the CSIRO and the Asia-Pacific Roundtable on Sustainable Consumption and Production (APRSCP), with support from the European Union's SWITCH-Asia Programme.

An important part of this project was the creation of an interactive web-tool (see above) allowing policymakers to explore the database in detail in an intuitive way. We created a 'heat map' that allows comparison between a wide range of economic indicators for different countries. Mousing over the countries reveals the actual data.

Carbon Visuals has shown us different techniques to visualize data in a way that can resonate on a meaningful human level, while still giving us creative space for collaboration. We had a lot of fun with the team and it's been a really wonderful partnership.

Janet Salem, UNEP, Bangkok

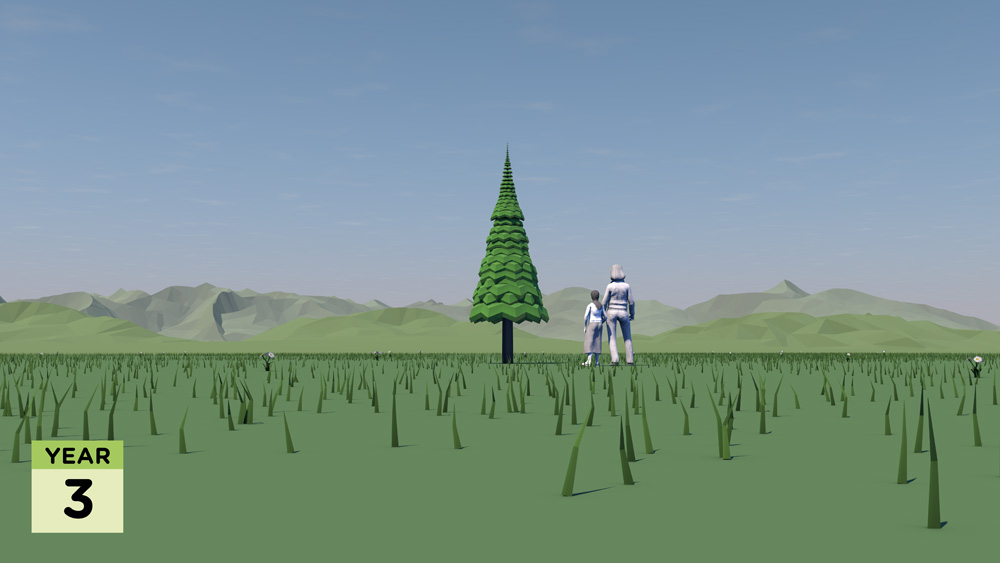
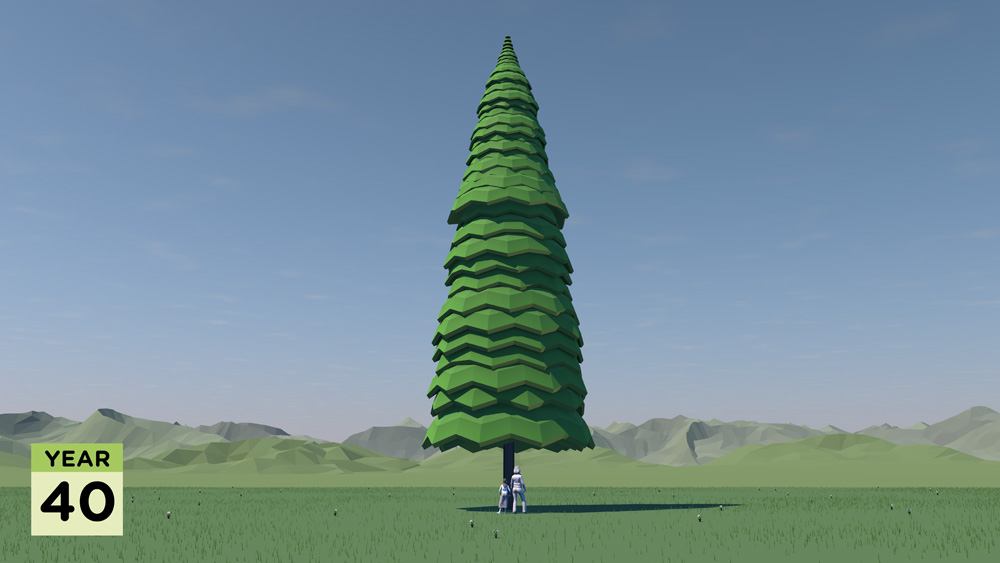
Making sense of carbon, trees and timber

CLIENT

Wood for Good

PURPOSE

To find a new way to communicate the carbon benefits of using wood and timber in the UK construction sector.

DESCRIPTION

A series of short animated films and case study images using Wood for Good’s data to reach construction professionals, policy makers and the public.

The competence and skill you have in handling large data sets is absolutely fantastic. And you still delivered a wonderful set of visuals for us that we can continue to use for a long time to come.

Craig White Chairman, Wood for Good

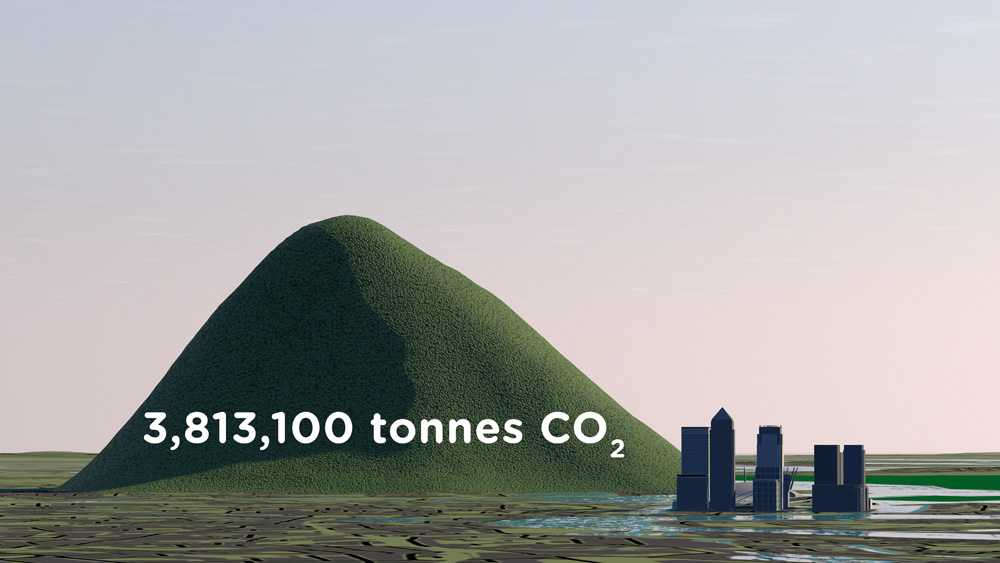
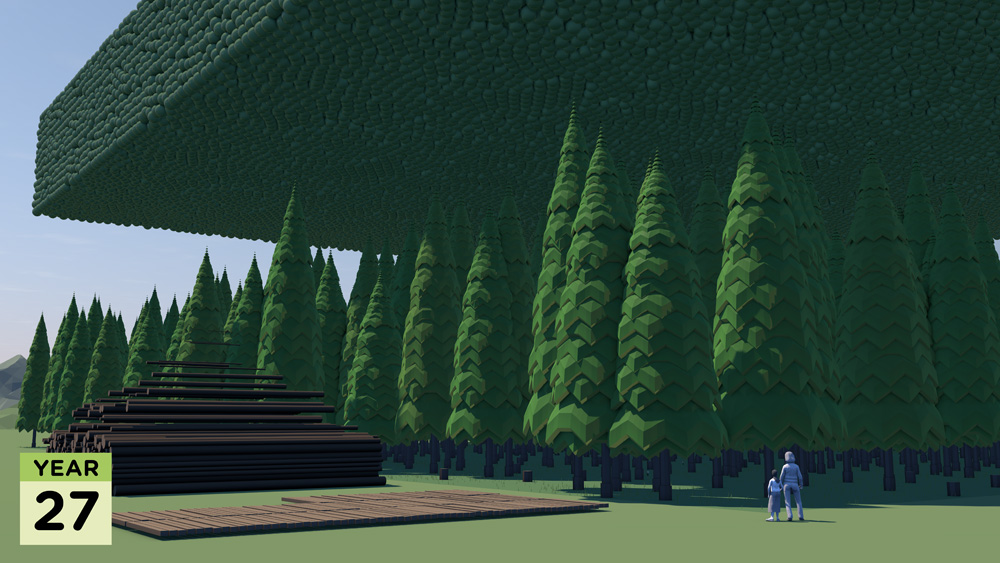
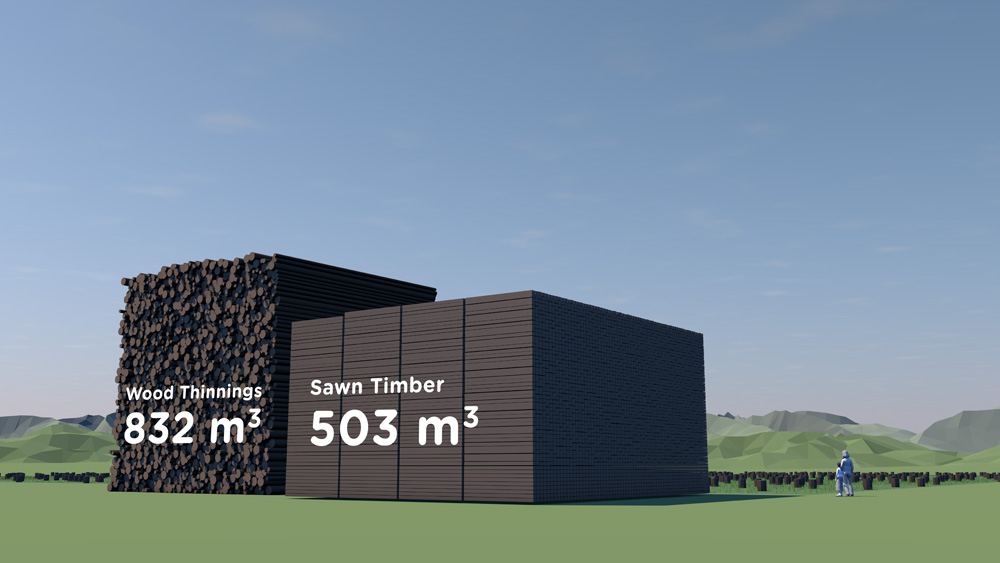
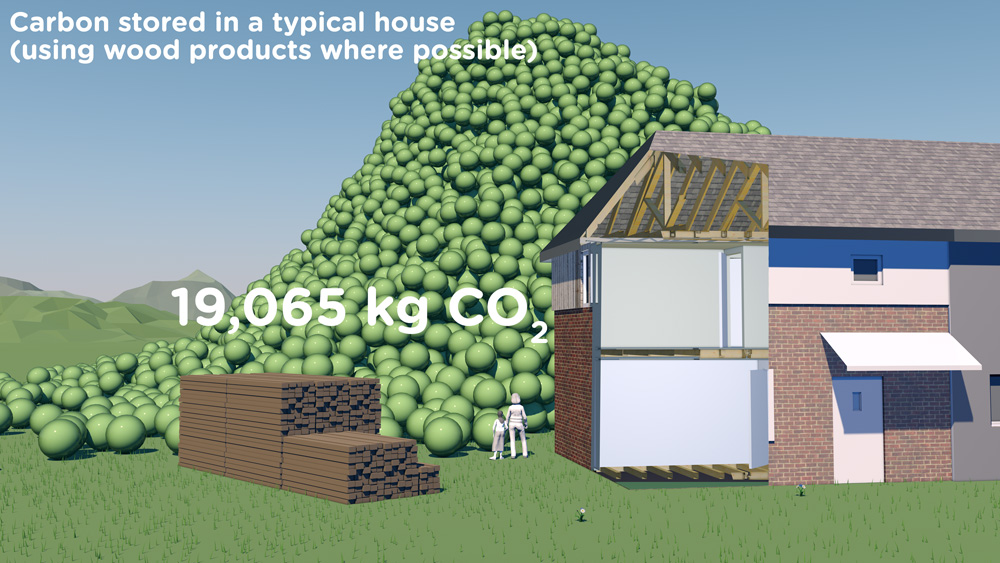
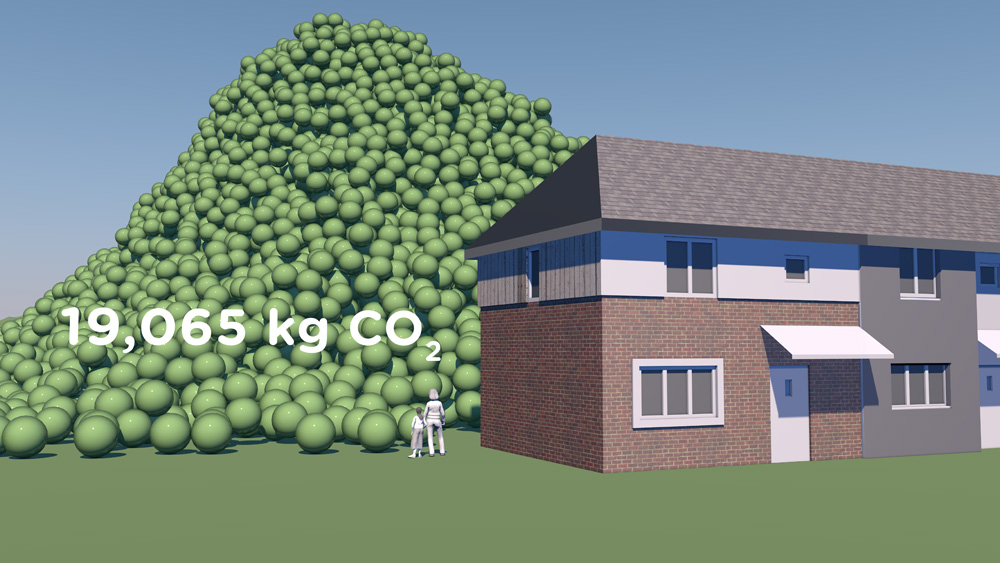
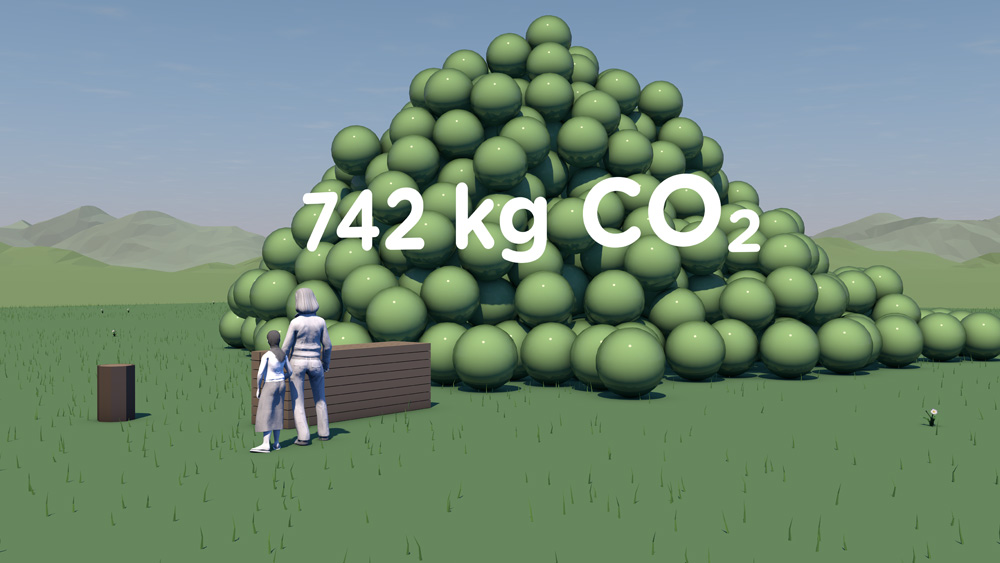
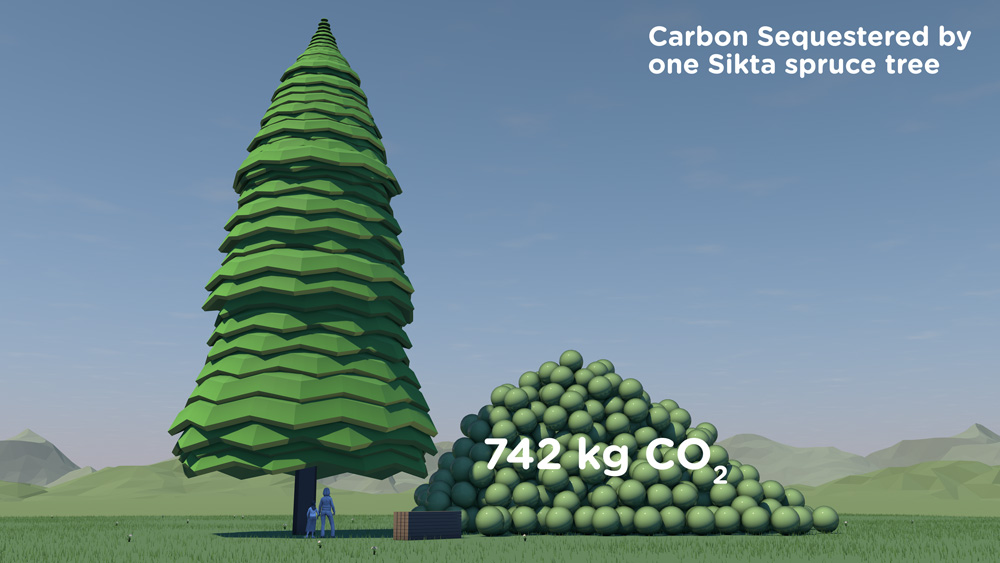
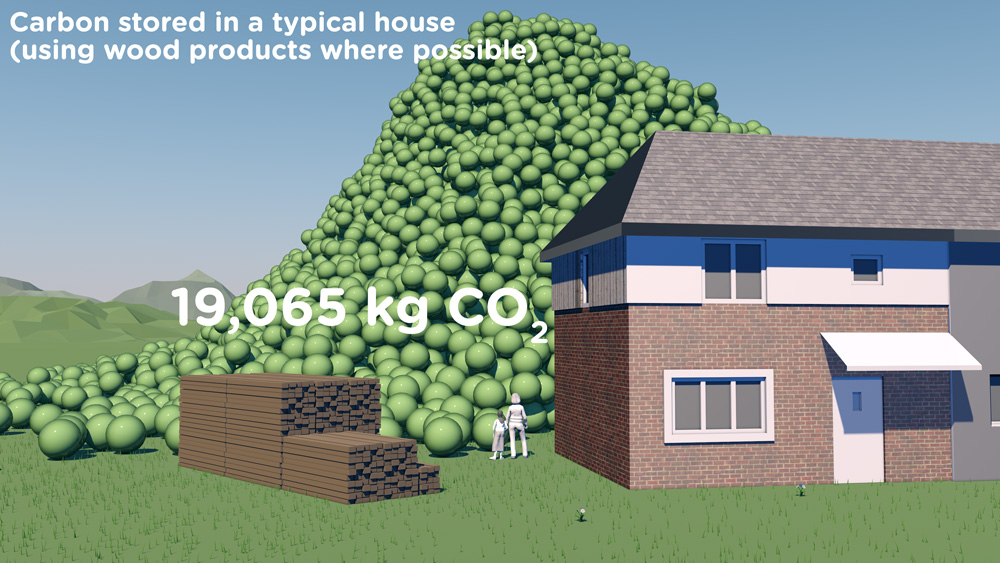
How much carbon is stored in a tree? How does that translate into cut timber and wood products? And how much carbon can be ‘banked’ by using timber for building houses in the UK?

These questions are raised and answered in a communication project that includes a series of short animated films and set of case study images created by Carbon Visuals for Wood for Good, the UK's wood promotion campaign.

The aim was to find a new way to communicate the positive carbon benefits of using wood and timber in the UK construction sector not just to construction professionals but also policy makers and the public.

Given the wide nature of the brief we agreed with the client to start the project with a scoping phase. During this, it was decided to split the film into three separate sections that could each work as short stand-alone films, rather than only as one single complex narrative. In addition we agreed to create a set of case study best practice images showing the carbon ‘banked’ in high profile buildings and timber products.

It has been very satisfying to shape and create a project which has both a business focus and important educational potential. I would like to see us working with more trade bodies and campaigns that have an important carbon message to get across.

Antony Turner, CEO Carbon Visuals

By liaising closely with the client in this initial phase we were able to spend time working up a communications plan, sourcing and examining appropriate data and creating draft film storyboards. This established a sound basis for the production schedule, culminating in all visual materials being ready for the campaign launch.

Data Sheet with methodology, data and references available here.

See Wood for Good website page here.

See our post-production video (giving insight from our clients on the project) here.

Emissions, sequestration & stored carbon on upland farms

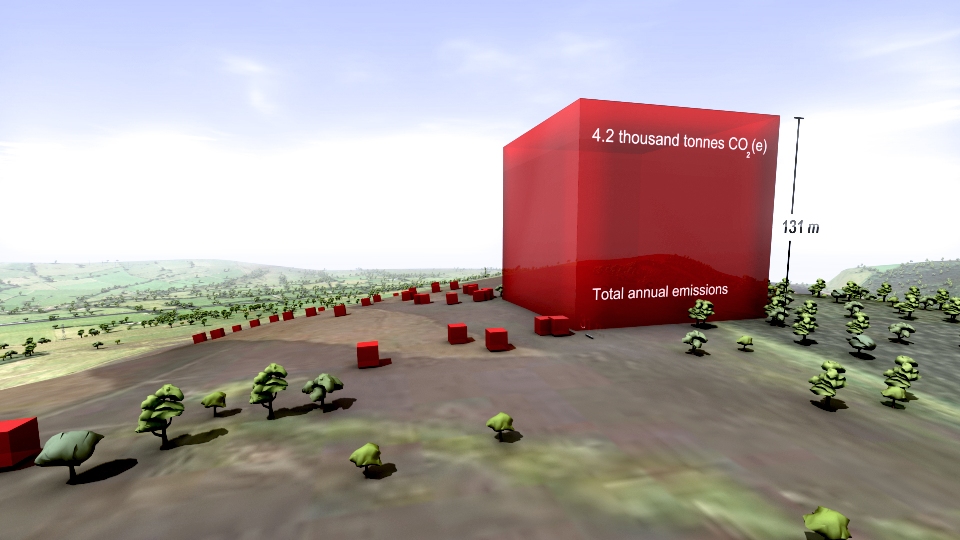
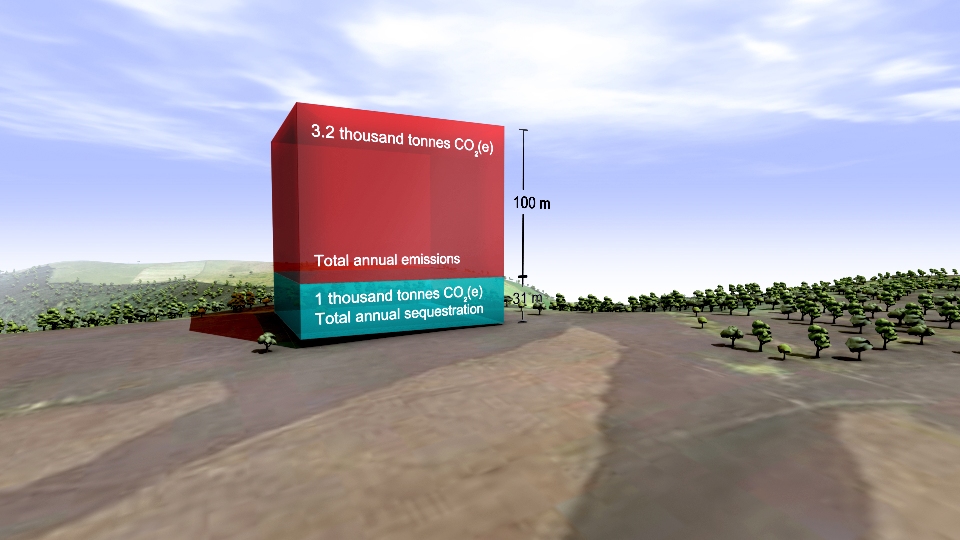
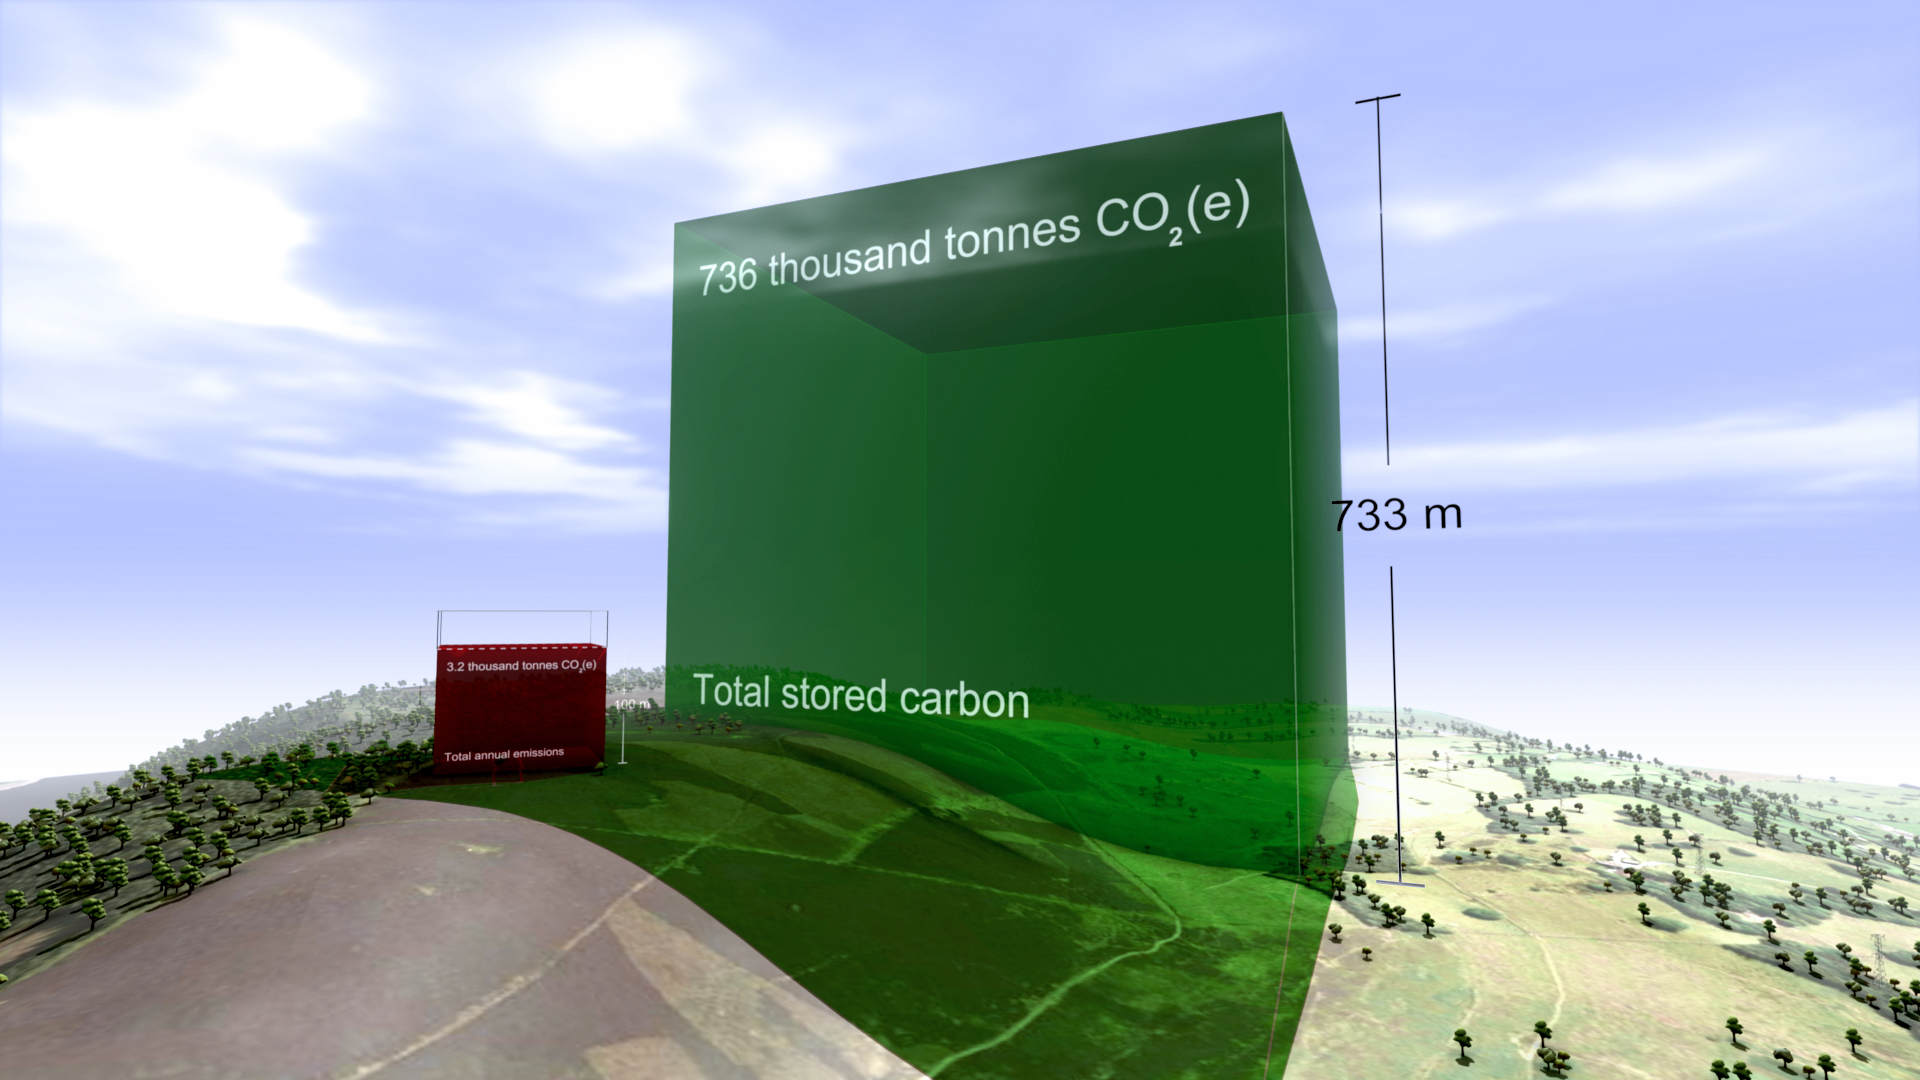
Carbon Visuals have created this short animation film to show the emissions, sequestration & stored carbon on ten upland farms in the Peak District National Park. The farms extend over 1,500 hectares and comprise part moorland, part pasture.

The data was taken from ADAS Report Environmental Quality Mark (EQM) Farm Carbon Footprint and Water Audit Pilot Project.

The core message from the film is that these farms are not only producing food and preserving the landscape. They are performing an important role as guardians of a huge carbon store that is best kept in soils and vegetation.

We believe that this is a 'world first' for this type of medium. Created for the consultancy ADAS, the film demonstrates the potential for moving animation to communicate complex carbon stories.

The film is being used to engage a variety of stakeholders including ADAS staff, farm managers and agricultural policymakers.

To see all our work for ADAS, click here.

If you like this approach, and feel that it would suit your particular carbon communication challenge, then please contact us.


Showcasing ADAS carbon consultancy capability

ADAS provides environmental solutions, rural development services and policy advice. The company is leading projects on GHG methodologies and mitigation measures for food production and agriculture in the UK.

For both simple and complex foods, the key is to understand the production processes of crops and animals in intensive, extensive and organic production systems.

The company asked Carbon Visuals to provide a series of images to showcase their carbon management consulting capability to the food and agriculture sector.

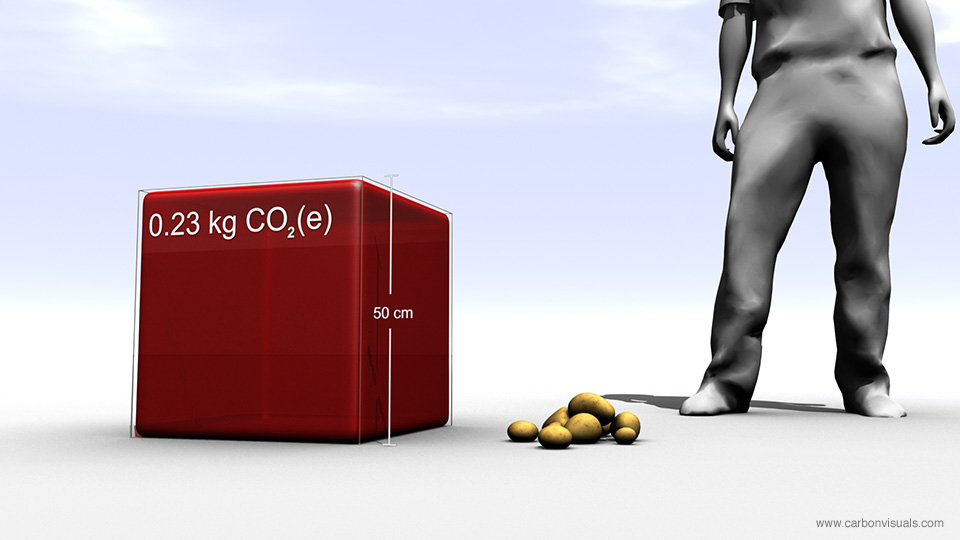
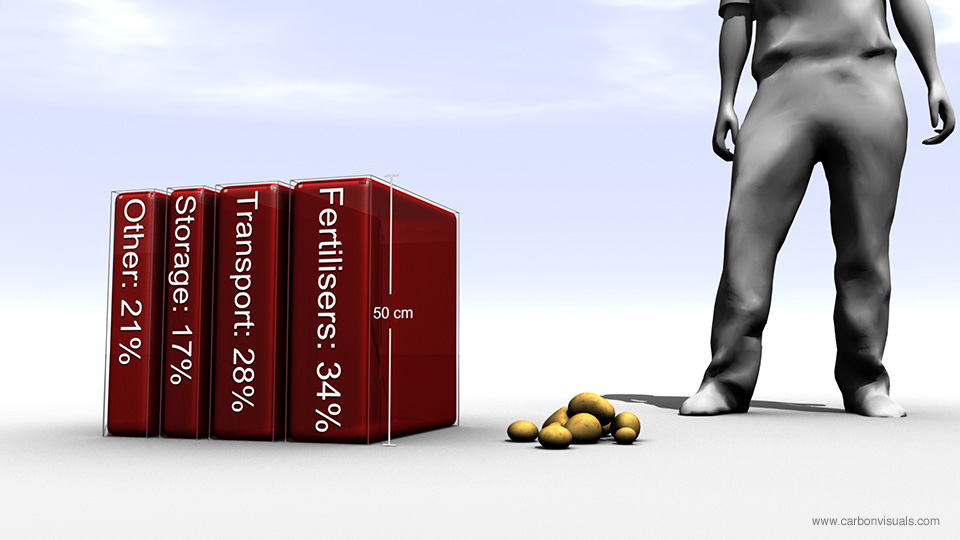
We created images depicting the carbon footprint of potatoes in relation to the production of school meals in the UK. In addition we provided an animated film showing the emissions, sequestration and stored carbon on ten Peak District farms.

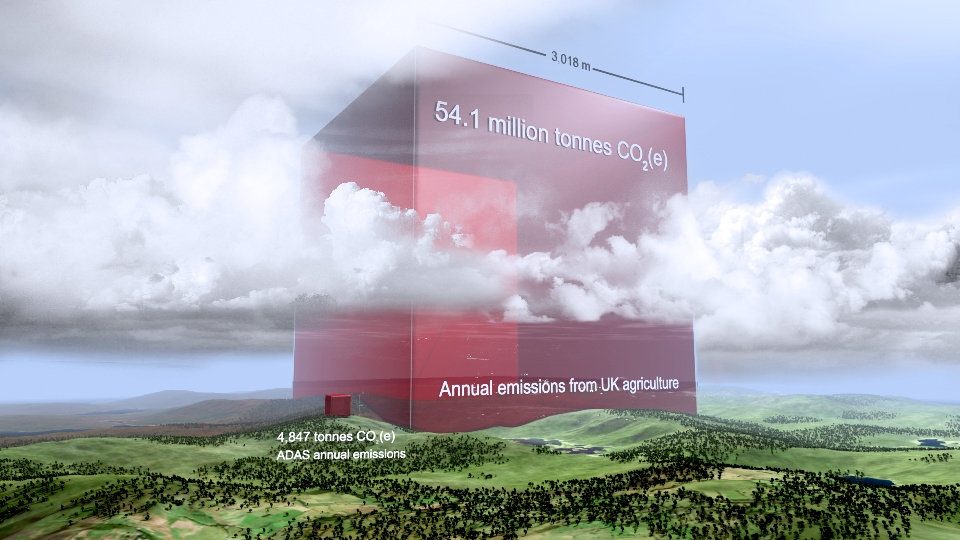
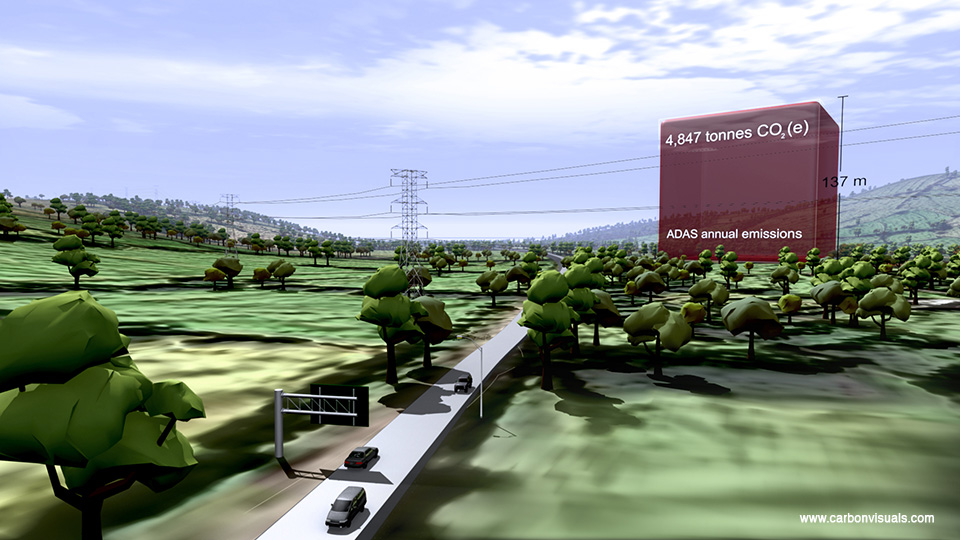
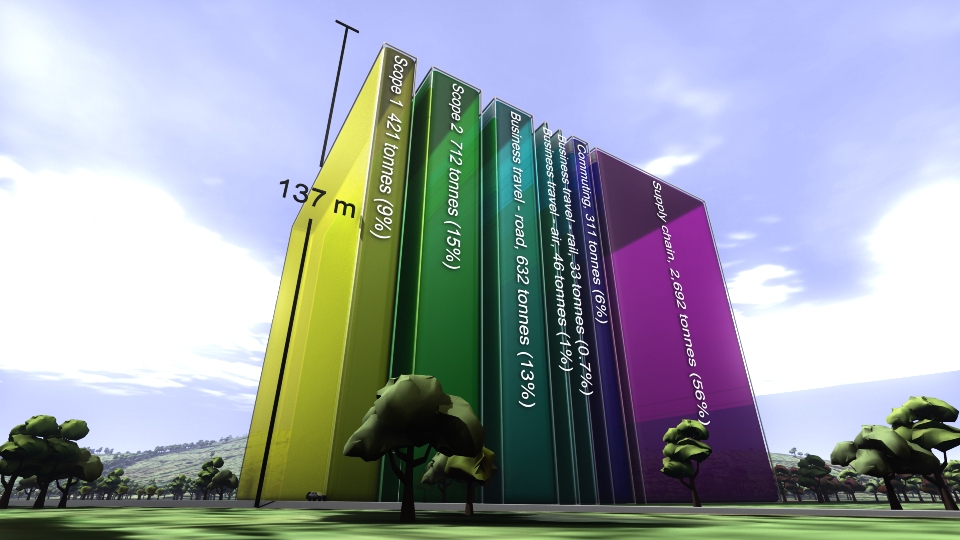
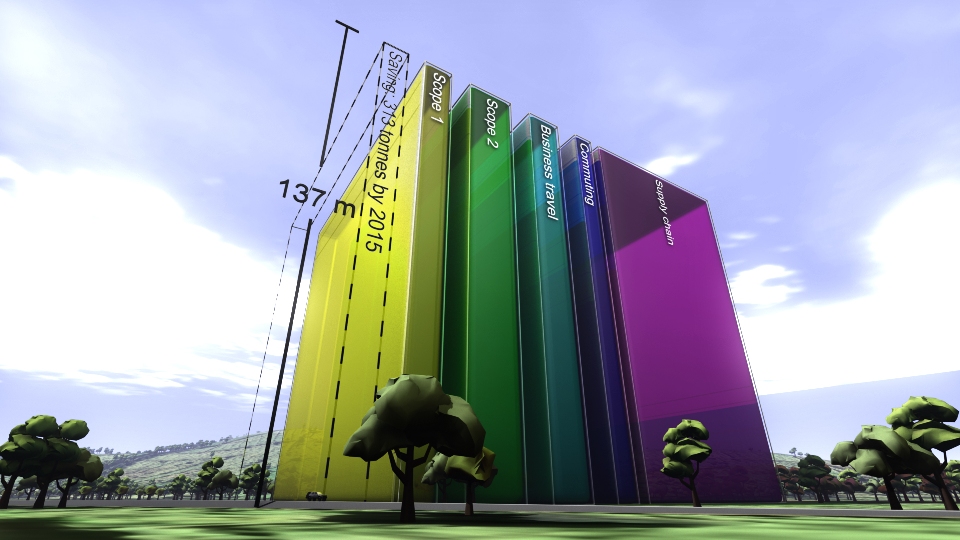
Finally we produced a set of images to show the company's own carbon footprint and their reduction target. This included a comparison with the total emissions from UK agriculture - which they are able to influence through their consultancy practices.