CLIENT
New York City Clean Heat Program
PURPOSE
To help New York property managers, building co-op boards and community groups reduce local air pollution from their buildings.
DESCRIPTION
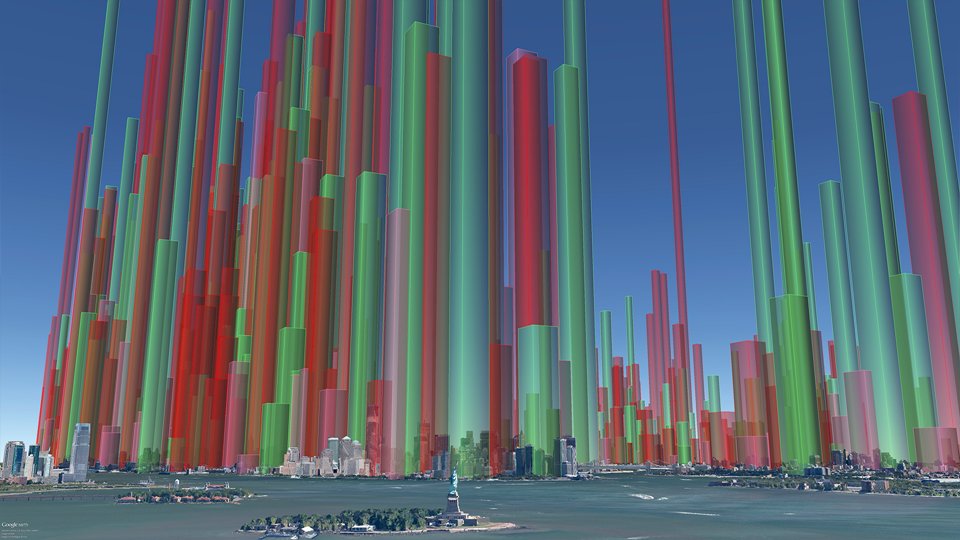
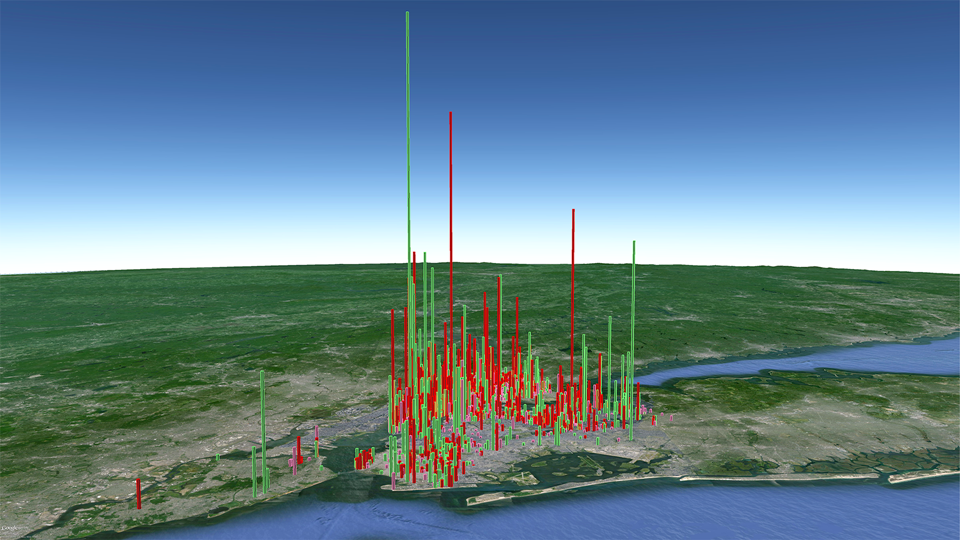
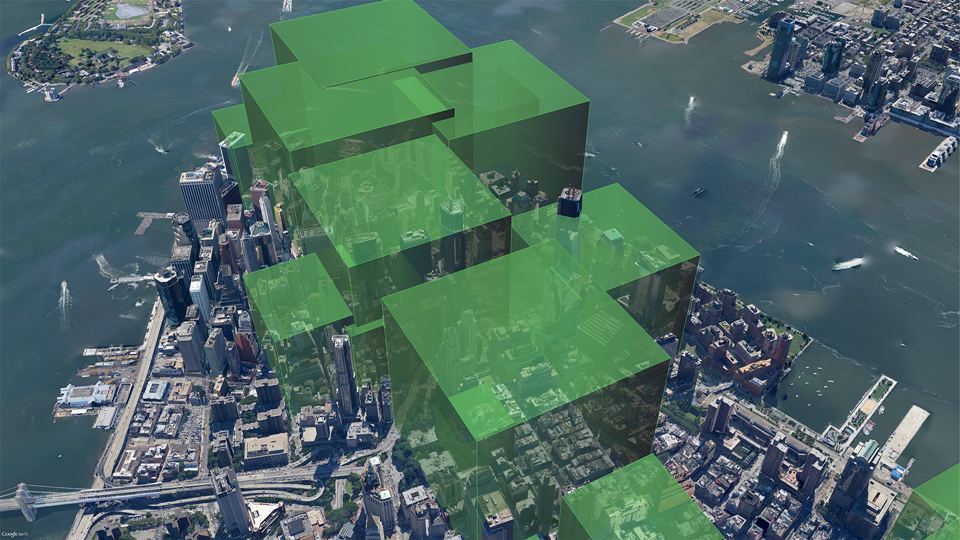
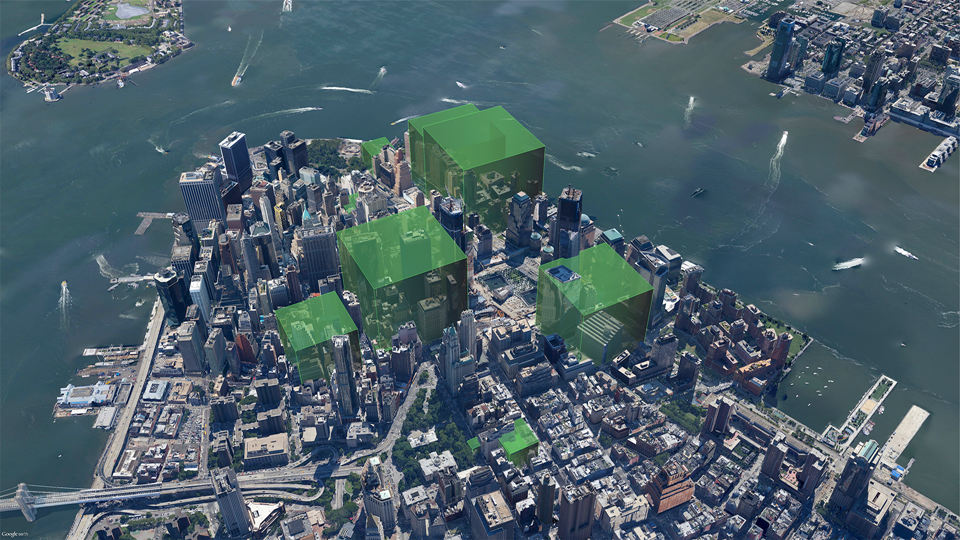
A set of before and after images showing volumes of air saturated with particulates, created using our Google Earth Visualiser tool.
Visual images created by Carbon Visuals are being used to help New York property managers, building co-op boards and community groups reduce local air pollution from their buildings.
Around 8,000 buildings in New York City have been burning heavy heating oil. These contribute more soot pollution than all cars and trucks on the City’s roads. The NYC Clean Heat program seeks to improve air quality and save lives in New York by eliminating heavy oil use and accelerating the adoption of cleaner fuels.
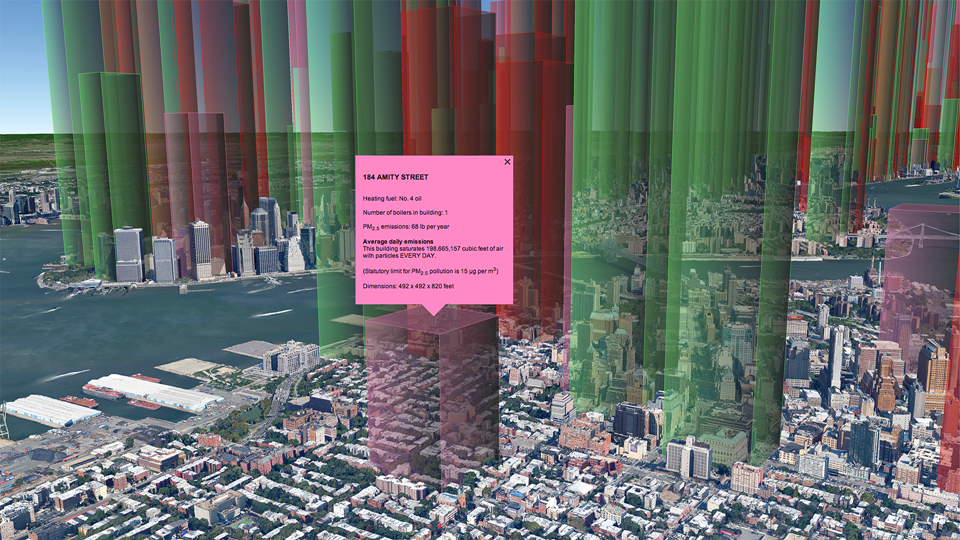
Carbon Visuals was asked by Clean Heat project partner Environmental Defense Fund to look at ways to visualise the emissions of fine particulate matter (PM2.5) in order to encourage building owners and operators to sign up to the program.
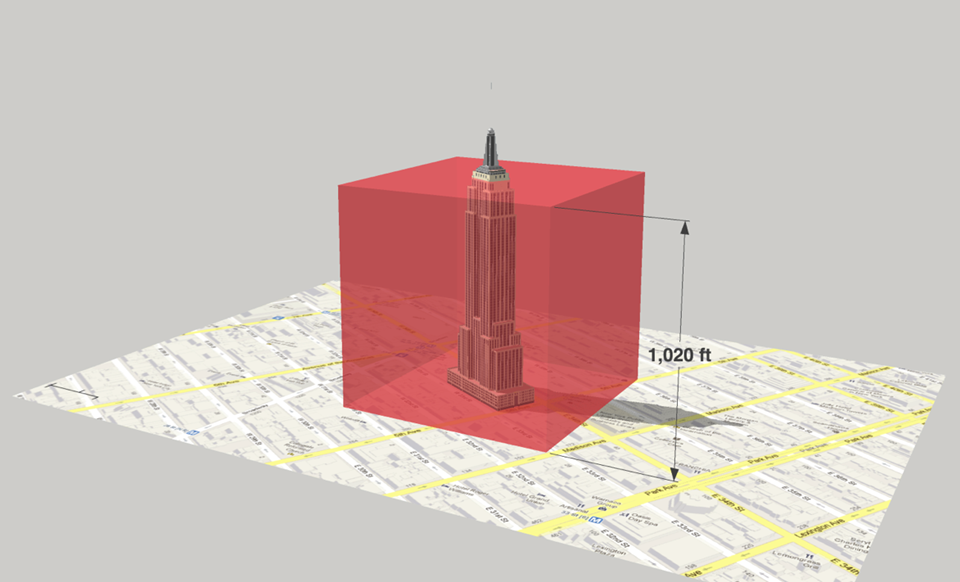
Visualising quantities of particle pollution is not easy. The air that supports the particles plays a part in making them dangerous to health (by itself, a pile of powder is not a threat)!
The Clean Heat project team have used the visuals for individual building outreach and in presentations. They have found that those buildings that receive visual prompts are very likely to get in touch with the program.
How we created the images
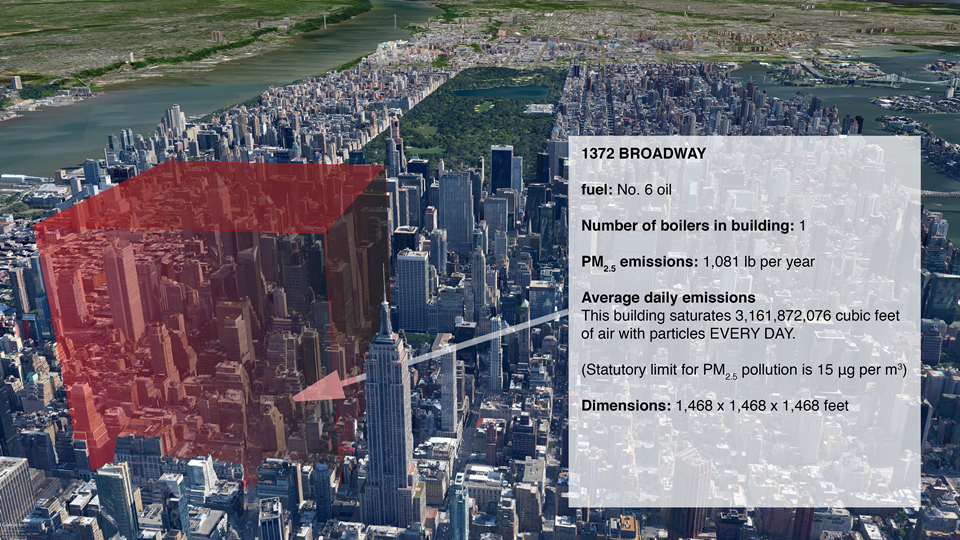
We used our Google Earth Visualiser tool in a new way. Usually we use it to show volumes of carbon dioxide emissions but we chose to visualise particle pollution in terms of the volume of air it 'saturates' up to the legal limit*. The coloured volumes represent air that is 'full' of particles.
Of course, particle pollution doesn't actually work so neatly. It gets mixed up and you will find an uneven distribution in city air, but the object here is to visualise the scale of emissions.
More info on EDF's Clean Heat Project. Dedicated NYC Clean Heat website
* Max density of PM2.5 pollution averaged over an annual period: 15 μg/m3 EPA Regulator ref: 40 CFR 50.7(a)
Thank you so much for your wonderful work! We have found your visuals an incredibly useful tool both for direct building outreach as well as for our marketing campaign. Our colleagues at the Mayor’s Office have also let me know how impressed they are.
Abbey Brown , NYC Clean Heat Coordinator, Environmental Defense Fund
A comprehensive set of images can be seen in this downloadable PDF Presentation.