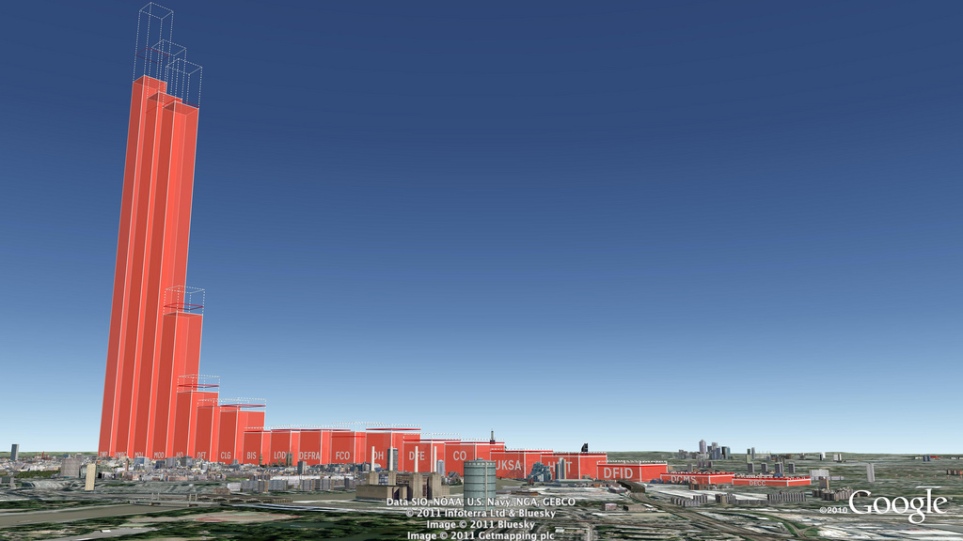
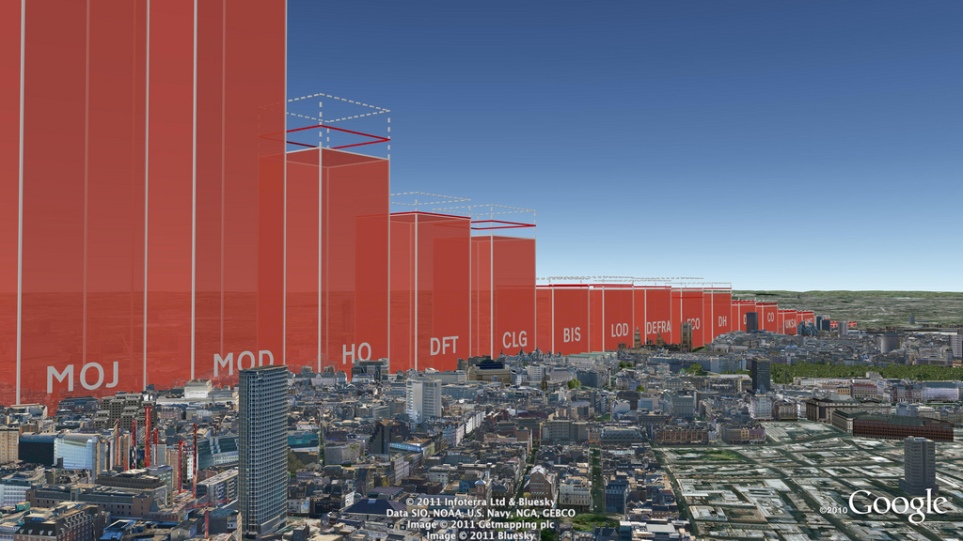
CLIENT
UK Department of Energy & Climate Change (DECC)
PURPOSE
Use social media to get young people interested in a 70 page report.
DESCRIPTION
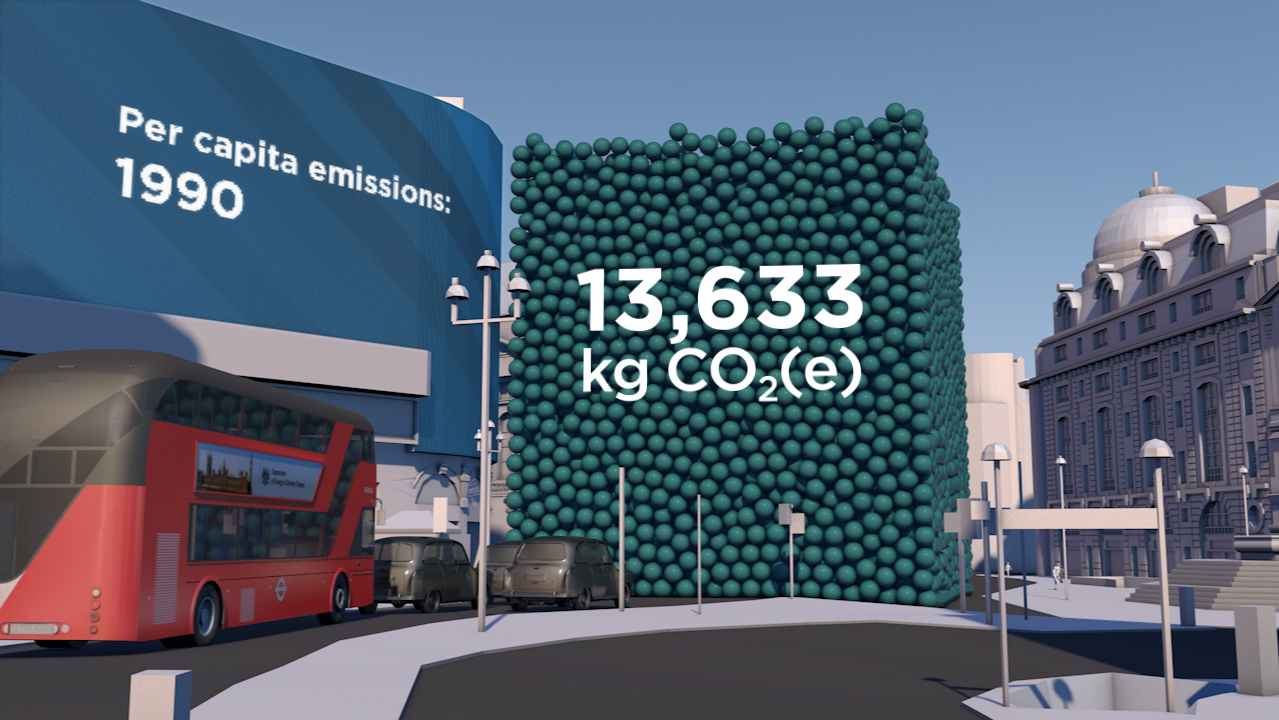
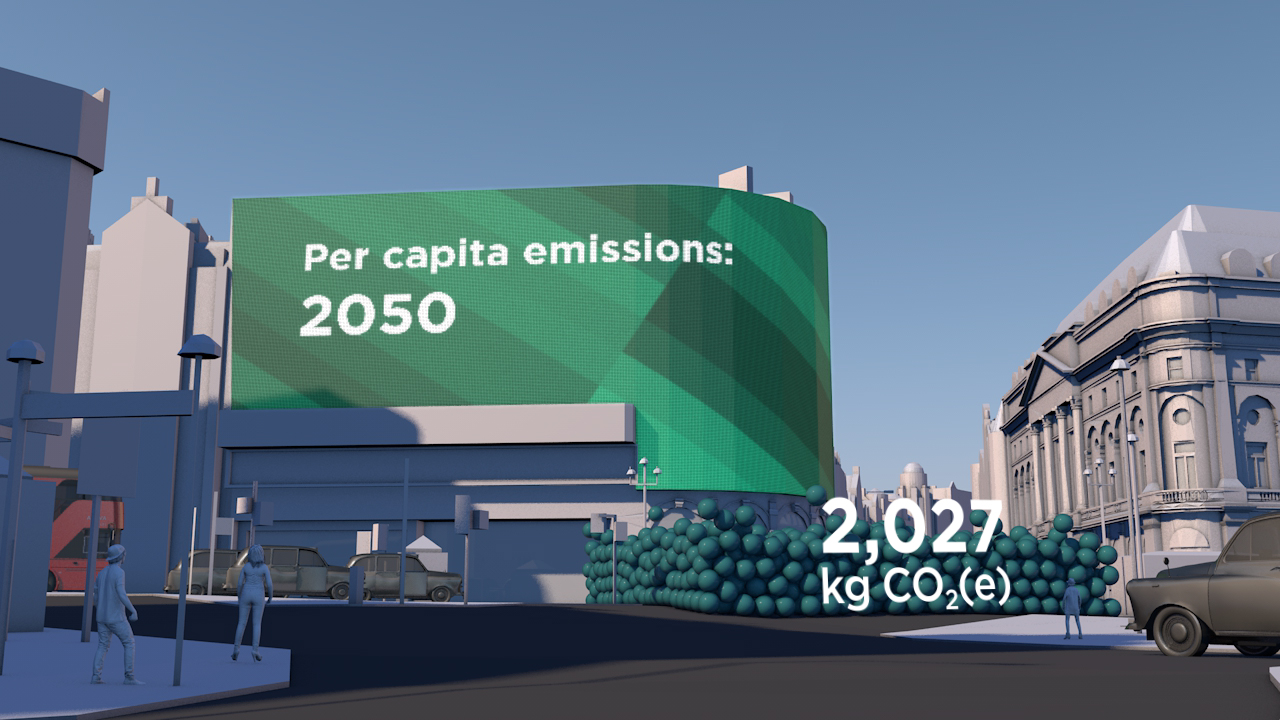
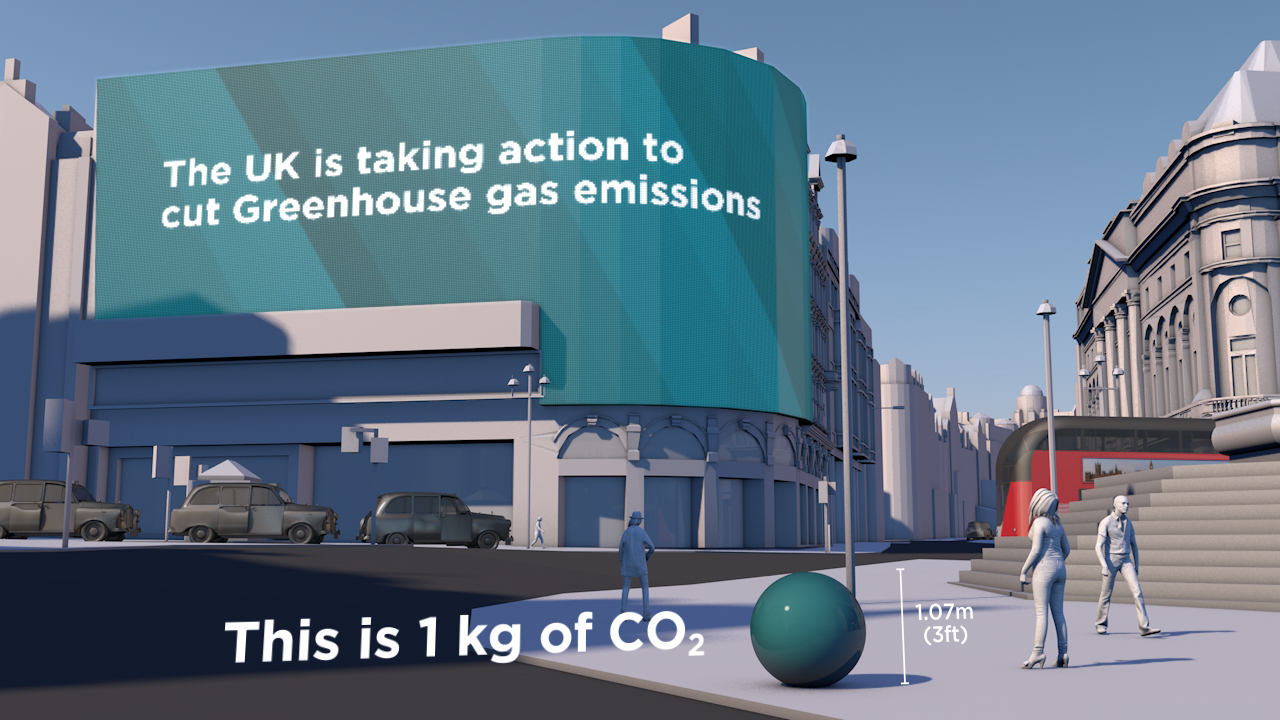
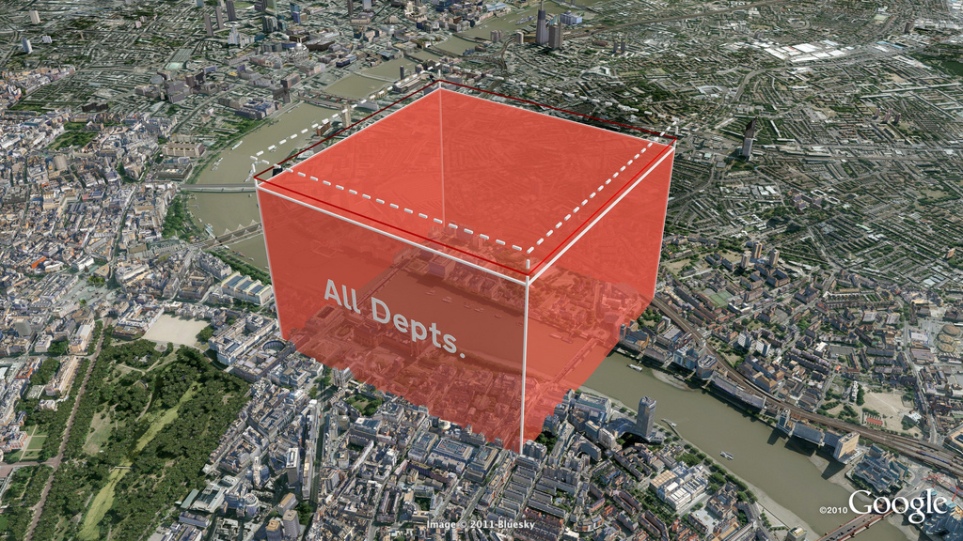
An animated drama set in Piccadilly Circus – a popular and iconic gathering place for young and all. The scene is transformed into a memorable moving picture that shows the UK Government’s 2050 target on the scale of one person.
We are very happy with the film, and particularly thrilled that it was our first Vine and had 5000 loops in 5 days.
David Armstrong, Head of eCommunication & Digital Media, DECC
How do you create a stir on Twitter and other social media to get interest in a 70 page Report?
That was the task facing the UK Department of Energy & Climate Change (DECC) who wanted to commission a compelling image set and short animation to draw attention to a new Report - Paris 2015: Securing Our Prosperity Through a Global Climate Change Agreement.
A fast turn-round meant an immediate focus on a key compelling message that could be visualised. Fortunately the UK government has a particularly positive message on carbon - with an 80% reduction target for 2050 enshrined in law. So we set about clarifying the data and thinking through visualisation ideas.
The result: a visual drama set in Piccadilly Circus – a popular gathering place for young and all and itself a unique and iconic location. With captions and messaging appearing as adverts, this immediately recognisable scene is transformed into an eye-catching and memorable moving picture that shows the target on the scale of one person.
See Number 10 Storify page for these images in use.
See video on YouTube. See VINE version
Technical Notes
Raw numbers:
UK Population 1990: 57,237,500
UK Population 2050 (projection): 77,000,000
GHG Emissions 1990: 777.6 MtCO2e
Derived values:
2050 target emissions (80% reduction): 155.52 MtCO2e
Per capita emissions 1990: 13,586 kg
Per capita emissions target 2050: 2,020 kg
Per capita saving target (1990 to 2050): 11,566 kg
Population figures and projections come from Office for National Statistics (ONS); GHG emissions from DECC.

