
Instead of trying to communicate the complexities of climate change, we believe that a simple understanding of how we are changing the atmosphere of the planet could transform society’s view of the need for a low-carbon future.
Every day we wrap the planet in a paper-thick layer of carbon dioxide!
We’ve done the maths and it’s true. The 80 million tonnes of CO2 we release to the atmosphere every day by burning fossil fuels would be 80 microns thick if it were a single, uninterrupted layer at 100% concentration over our heads. Over the course of a year, that amounts to 31mm, or over an inch.
We call this imagined layer the Carbon Quilt – since pre-industrial times its thickness has increased from 2.3 metres to 3.2 metres.
In 2010, with support from The Tedworth Charitable Trust, we 'soft-launched' our Carbon Quilt web-tool that enables people to ‘see’ any carbon footprint – from a short car journey to the footprint of a country or continent. Any carbon footprint can be seen in proportion to any other, and in proportion to the global whole. It can also be positioned in a location that has meaning and provides a sense of scale for the person viewing it.
Carbon Visuals has ambitious plans to develop this technical prototype tool on Google Earth to bring the abstract concept of 'carbon footprints' to life for over a billion people worldwide.
We are now actively seeking funding and/or sponsors to help us to develop this project. Please contact us if you have funding ideas, contacts or expertise that could help advance this project.

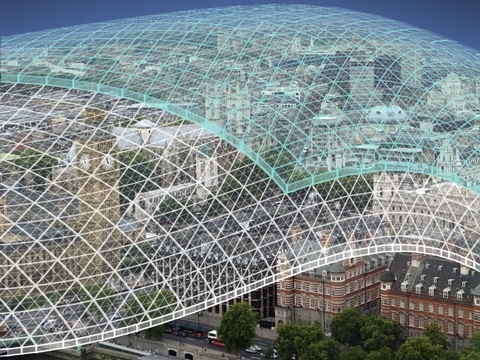
BITC Mayday Network businesses' carbon footprint (and reduction)
To the left is a picture for the BITC (Business in the Community) Mayday Annual Report 2010.
Each year humans release enough carbon dioxide to cover the entire planet in a layer 37 mm thick. The proportion of this 'quilt' that reporting Mayday Network businesses are responsible for is the green 'patch'.
Total reported emissions in 2010 (green patch) is 5.6 million tonnes of CO2(e). Emission reduction in previous 12 months is shown as the dotted area.
It represents a saving of 400 thousand tonnes of CO2(e).