Some offices organise a sweepstake for the World Cup. However, perhaps predictably (unlike the semi-final on Tuesday) we got interested in the associated emissions of this occasion. We started to think – what would the carbon story of a global event like this look like? Luckily we could turn to FIFA's own comprehensive calculations document to find out.
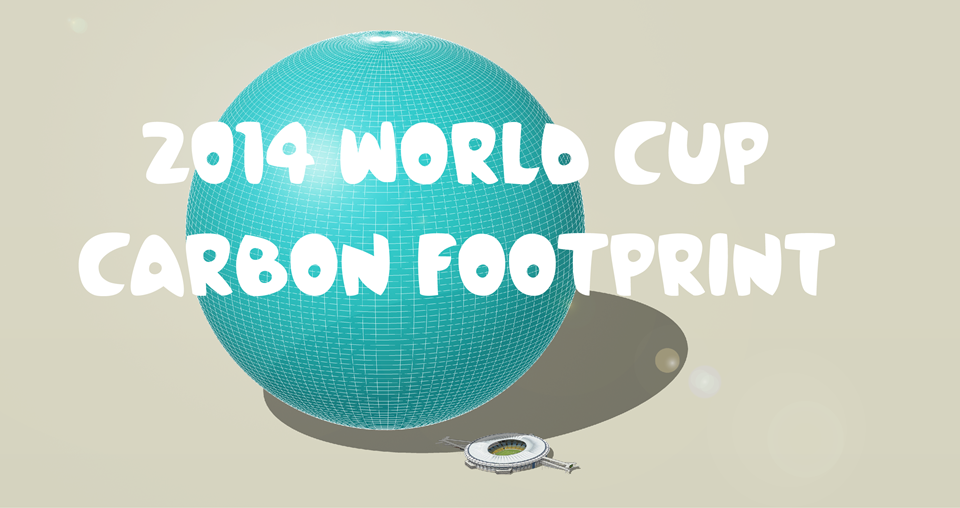
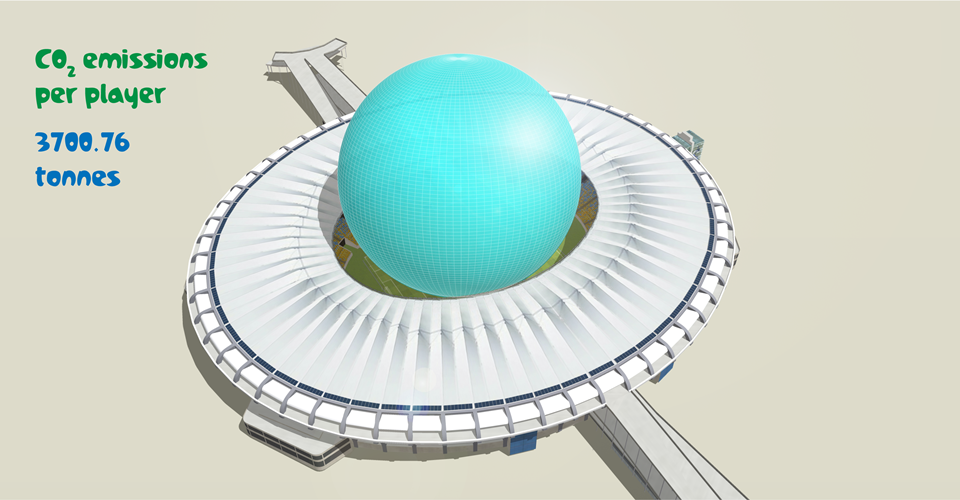
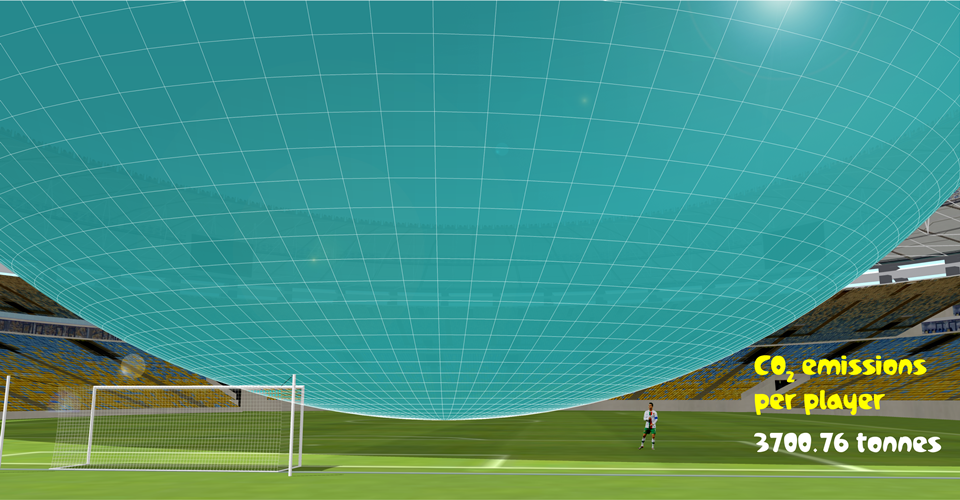
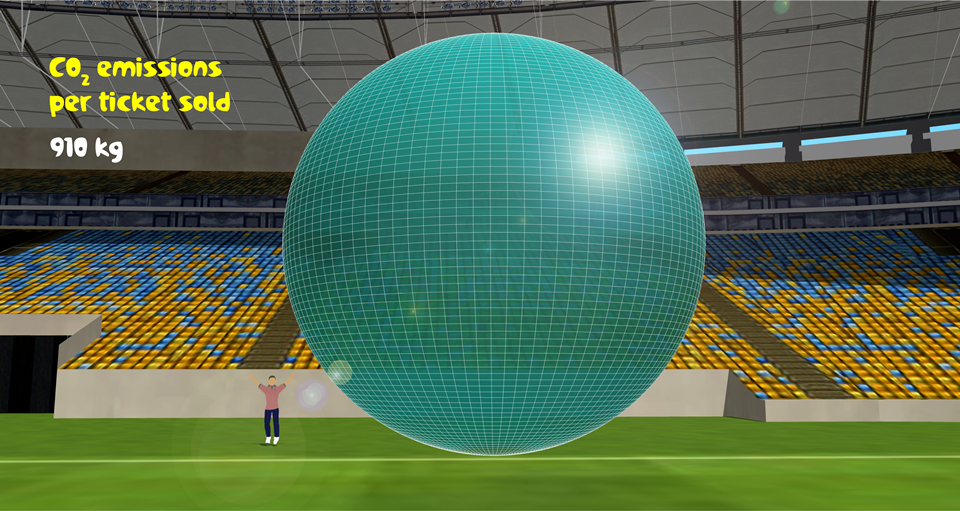
However you look at it the carbon visuals for the World Cup are quite striking. An image of the carbon emissions of each player fits a little too snugly in the Maracanã Stadium. Per ticket, if the emissions were placed as a sphere in front of you they would definitely spoil your view of the pitch. And those of the whole championship dwarf the stadium by some way.
Needless to say we forgot about allocating the sweepstake in all our calculations and sketches. This has an upside - we get to cheer Germany and Argentina on with equal measure on Sunday.
Consequently there are no losers at the end of the day for us. Well - except perhaps the delicate balance of the Earth’s atmosphere – but that is another global challenge altogether.
These images have been produced by Jake Whittle, a talented work-experience student with us this week, working with Dan Ulf-Hansen. Therefore, a special thanks to Jake and we wish you very well with your studies.
Data:
Summary of the 2014 FIFA World Cup Brazil™ Carbon Footprint
Images available for download from Flickr here.


